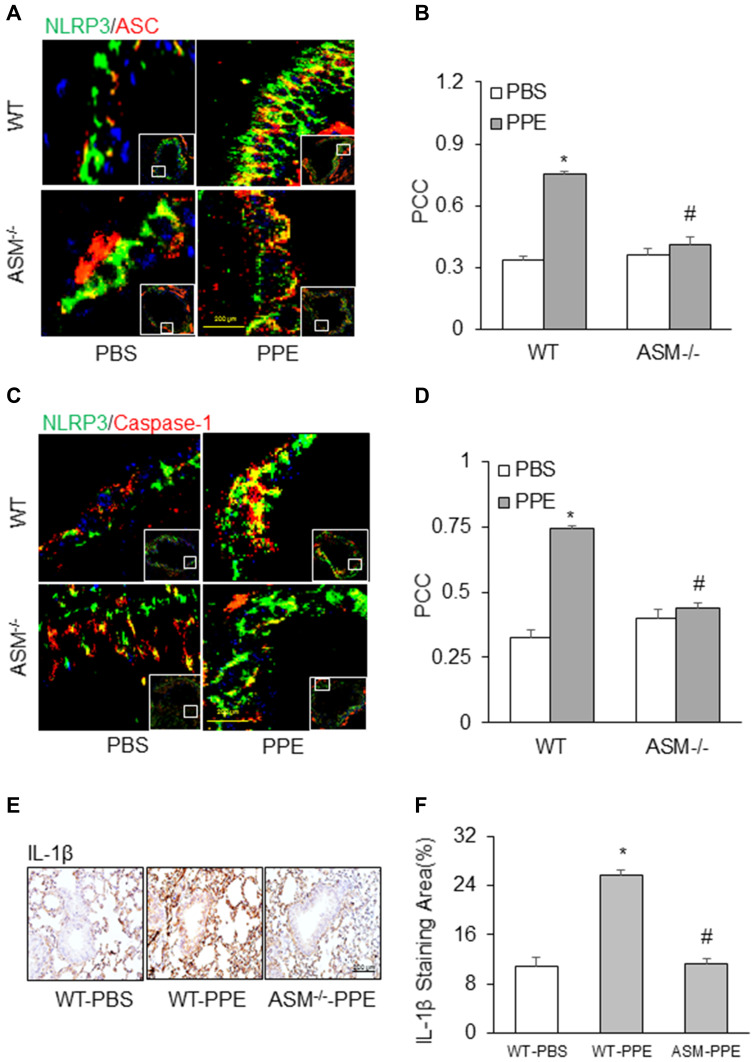
Figure 5.
Inhibition of NLRP3 inflammasome formation and activation in acid sphingomyelinase (ASM) gene knockout mice receiving PPE instillation. Representative photomicrographs depicts NLPR3 colocalization with (A) ASC or (C) caspase-1. (B and D) Summarized data in the bar graph shows PCC. (E) Representative images depicts IL-1β immunostaining in the lung. (F) Summarized data shows IL-1β levels in different treatment groups. (n=6). *P<0.05 vs WT mice with PBS treatment. #P<0.05 vs WT mice with PPE treatment.

