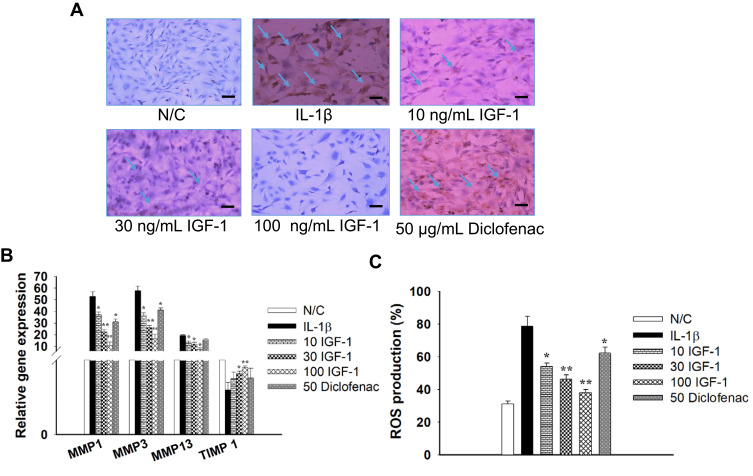
Figure 1.
Effects of IGF-1 on Chondrocytes during the development of OA induced by IL-1β 10 ng/mL, (A) immunohistochemistry staining for the existence of MMP-1 in vitro (× 200, Scale bar = 200 μm), (B) Real-time PCR on mRNA for MMP-13, MMP-3, MMP-1 and TIMP-1, and (C) quantitative histogram of ROS production. Here, N/C= Normal control, IL-1β = 10 ng/mL IL-1β, 10 IGF-1= 10 ng/mL IGF-1, 30 IGF-1= 30 ng/mL IGF-1, 100 IGF-1= 100 ng/mL IGF-1, and 50 Diclofenac= 50 μg/mL Diclofenac. Values are the mean ± SD. *p < 0.05, and **p < 0.01.

