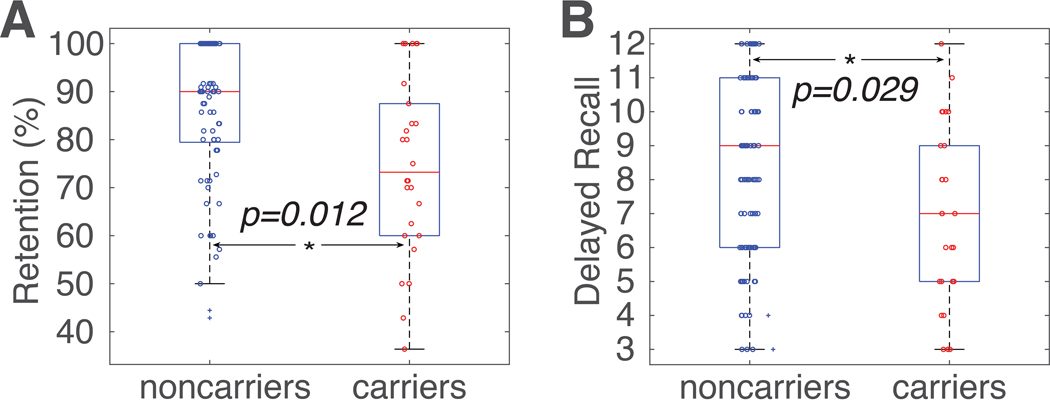
Figure 1. Group differences in HVLT-R retention and delayed recall.
(A) APOE ε4 carriers (red circles) had significantly lower HVLT-R retention rate than noncarriers (blue circles; blue crosses denote outliers that were more than three scaled median absolute deviations away from the median). (B) APOE ε4 carriers (red circles) had significantly lower HVLT-R delayed recall scores than noncarriers (blue circles). On each box, the central mark (red line) indicates the median, the bottom and top edges of the box are the 25th and 75th percentiles of the samples, respectively, and the whiskers extend to the most extreme data points not considered outliers. The two outlier subjects (depicted as blue +) in Figure 1A were identified using the isoutlier function in MATLAB. Similar results were obtained when the two outlier subjects were excluded (retention rate, F(1,91)=9.77, p=0.002; delayed recall, F(1,91)=7.08, p=0.008). HVLT-R, the Hopkins Verbal Learning Test–Revised. *, p<0.05.

