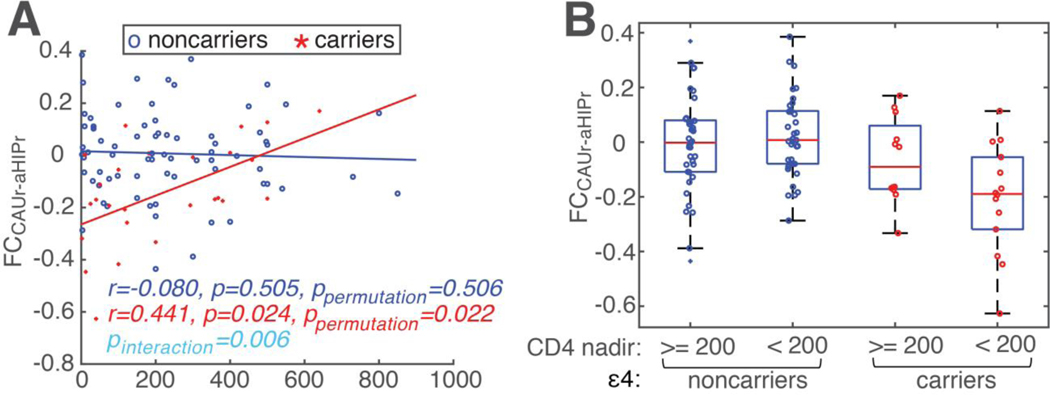
Figure 3. The interaction of ε4 status and CD4 nadir on FC between CAUr and aHIPr (FCCAUr-aHIPr).
(A) A general linear model (GLM) analysis revealed significant interaction of ε4 and CD4 nadir on FC between CAUr and aHIPr (FCCAUr-aHIPr) (F(1,90)=7.67, p=0.006, the cyan text in the figure), after controlling for age, education, sex, and race. For carriers: red crosses, data of each individual subject; red line, fitted regression line; red text, correlation coefficient between FCCAUr-aHIPr and CD4 nadir in carriers. Noncarriers were shown in blue color (markers (circles), line, and text). (B) The subjects were further divided into four groups, ε4 status (carriers versus noncarriers) x CD4 nadir (<200 cells/μl versus ≥200 cells/μl). A significant interaction between ε4 status and CD4 nadir was observed.

