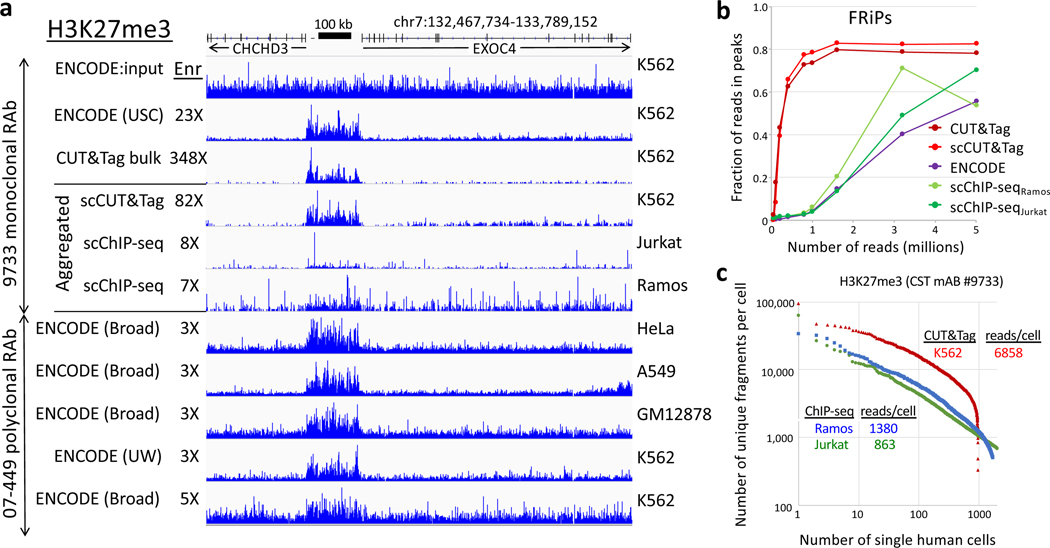
Figure 3 |. Comparison of single-cell CUT&Tag (scCUT&Tag) to single-cell ChIP-seq.
The same monoclonal antibody was used for H3K27me3 scCUT&Tag and scChIP-seq allowing a direct comparison of aggregated single-cell datasets. a) Tracks from a representative region of the human genome. Although different hematopoetic cancer cell lines were used, this region shows similar profiles for diverse cancer and normal lines (indicated on right). To quantify approximate signal-to-noise differences, we calculated the fold enrichment over the H3K27me3-enriched domain (132,768,919–132,935,822) relative to that for the flanking regions (132,467,734–132,768,918 and 132,935,823–133,789,152) for each track relative to the fold enrichment for the ENCODE USC K562 input track (“Enr” numbers for each track). b) Noisiness of scChIP-seq data relative to CUT&Tag data is confirmed by FRiP analysis. c) Knee plot showing the read/cell distribution estimated from aggregate data using the Picard Mark Duplicates program. Medians are indicated, where for scCUT&Tag all cells were scored and for scChIP-seq cells below a threshold were not scored.

