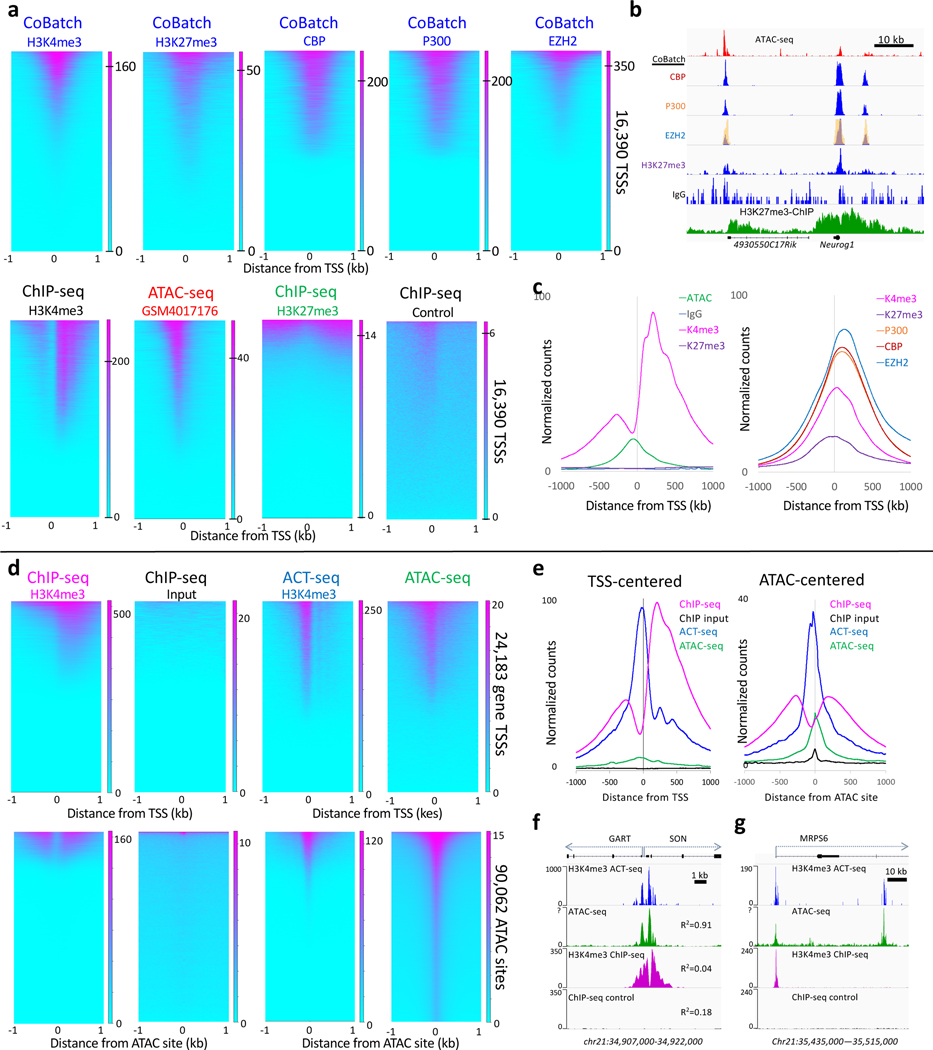
Figure 6 |. CoBATCH and ACT-seq peaks correspond to ATAC-seq peak summits genome-wide.
a) Heatmaps are similar between ATAC-seq summits and CoBATCH H3K27me3 signals but correspond to depleted H3K27me3 ChIP-seq signals in mESCs. LIkewise, CoBATCH CBP, P300 and EZH2 summits correspond to one another genome-wide with an ~10-fold larger dynamic range than is seen for ATAC-seq (0 to 200–350 for CoBATCH, 0–20 for ATAC-seq). For each dataset, heatmaps are ordered by decreasing normalized count density. The ATAC-seq track shown is better than average based on comparing mESC ATAC-seq tracks from 8 different laboratories (Supplementary Fig. 1). b) Representative examples from tracks shown Figure 2C of Ref. 19. The EZH2 track from the figure image (yellow) is superimposed over the track of the same region reproduced from the data in GEO, confirming correspondence between the published CoBATCH image and the source data used here. Profiles for CBP, P300 and EZH2 closely correspond to one another and to ATAC-seq peaks, although with much lower background, and lack the broad domains seen for H3K27me3 ChIP-seq profiles. c) Average plots of the data shown in panel a. d) Comparison of H3K4me3 ChIP-seq to ACT-seq and ATAC-seq heatmaps. ACT-seq shows a chromatin accessibility profile with a ~10-fold larger dynamic range than is seen for ATAC-seq (0 to 250 for ACT-seq, 0–20 for ATAC-seq). e) Average plot of the dataset shown in top panels of (d). f) A representative region showing bidirectional housekeeping promoters and R2 Pearson correlation coefficients over the region between ACT-seq, ATAC-seq and ChIP-seq from human K562 cells. g) A nearby representative gene region showing the promoter marked by ACT-seq, ATAC-seq and H3K4me3 ChIP and an intronic region marked by ACT-seq and ATAC-seq, but not by ChIP-seq. Heatmaps were separately ordered by signal over the displayed region using Deeptools.

