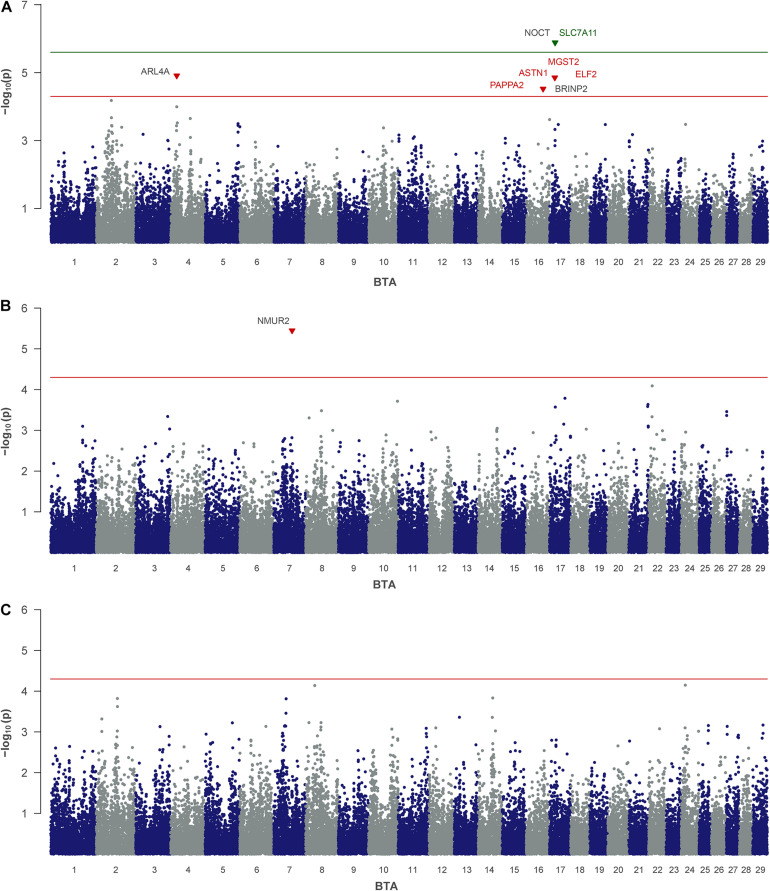
FIGURE 2.
Genome-wide association analysis of non-urea-nitrogen traits: (A) milk nitrogen, (B) uric acid and (C) allantoin. The red and green lines indicate suggestive and genome-wide significance thresholds, respectively. Genes with a suggested positional or biological association to the trait are indicated in red and green. Genes located closest to the right and left of the lead SNP in a 1-Mb window are colored in black.

