Figure 5.
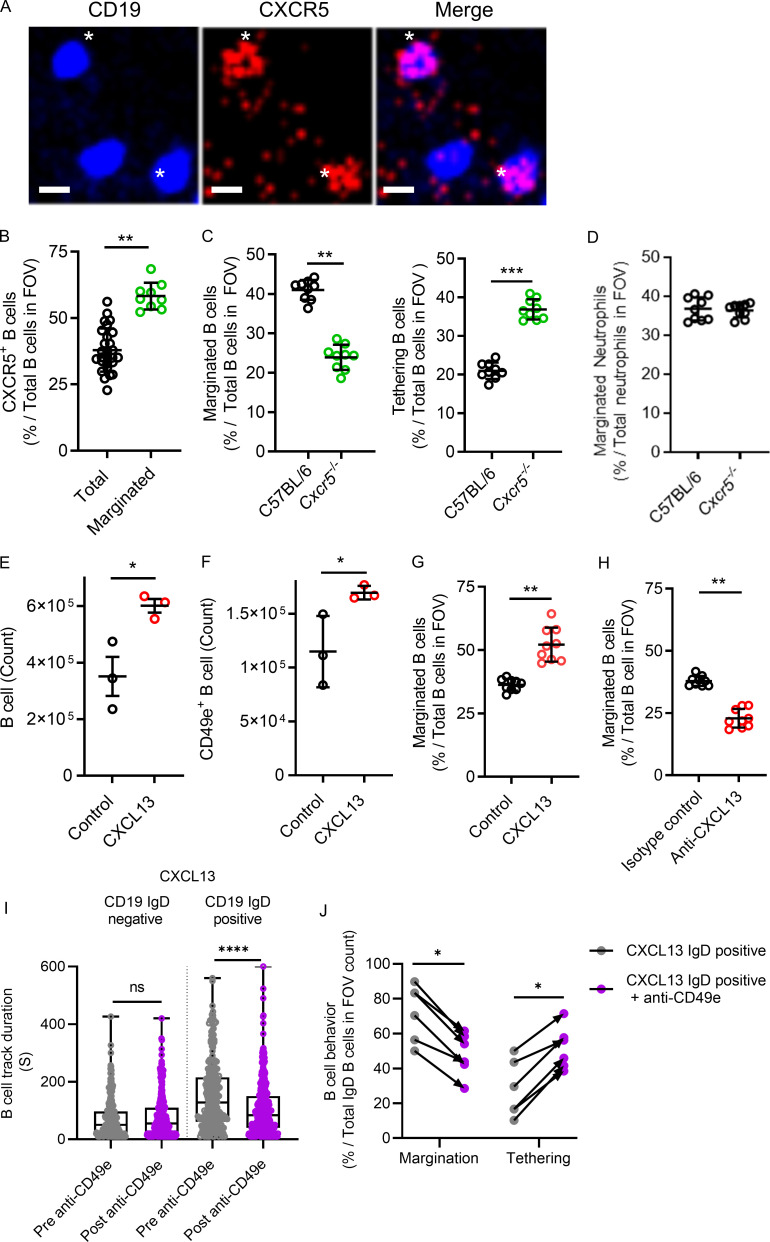
The CXCR5–CXCL13 axis modulates the level of B cell margination in the lung. (A) Intravital lung microscopy revealed B cells (Cd19ZsGreen1) that were visible for CXCR5 using i.v. administered, fluorescently conjugated anti-CXCR5 mAb and that were marginated. For clarity, B cells were falsely colored blue, and CXCR5 is red. Asterisks show two examples of CXCR5-positive B cells (representative images from n = 3 independent experiments using three mice; scale bars, 7 µm). (B) CXCR5+ B cells were compared with total B cells, as was the proportion of CXCR5+ B cells that marginated compared with total B cells observed in the FOV. (C and D) Intravital lung microscopy compared B cell margination and tethering in C57BL/6 versus Cxcr5−/− mice (C), while D shows marginated neutrophils. (E and F) Cd19Zsgreen1 mice were pretreated with exogenous CXCL13 i.t., and flow cytometry quantified total and CD49e+ lung B cells. (G and H) Intravital lung microscopy quantified B cell margination in purified CXCL13-pretreated Cd19Zsgreen1 mice or in Cd19Zsgreen1 mice that received systemic pretreatment with an isotype control antibody versus a neutralizing anti-CXCL13 mAb. (I) CXCL13 i.t. treated Cd19ZsGreen1 mice were costained for IgD, and B cells were quantified by track duration before and after administration of inhibitory anti-CD49e antibodies. (J) B cells were phenotyped for margination and tethering before and after anti-CD49e antibody administration. For imaging experiments, n = 3 individual experiments were performed. Pooled FOV replicates are shown for B–D, G, and H. I and J represent n = 3 independent experiments using six mice in total. Exact P values were determined using Student’s t test, except where groups were compared using the Mann-Whitney test. *, P < 0.05; **, P < 0.01; ***, P < 0.001; ****, P < 0.0001. Pooled data are presented as the mean of n values ± SD or as box-and-whisker plots showing median and interquartile range. Statistical testing was performed using the n values.

