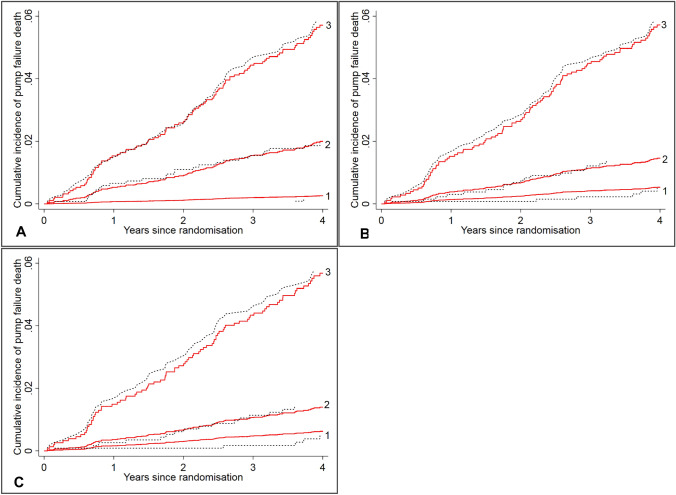
Fig. 2.
Observed vs. predicted cumulative incidence curves for pump failure death by tertile of the risk scores based on the pump failure death models in I-Preserve. a Pump failure death model 1 or 2; b pump failure death model 3; c pump failure death model 4. Red solid lines are predicted cumulative incidence curves based on the corresponding models, and black dotted lines are the observed cumulative incidence curves based on Aalen–Johansen estimators

