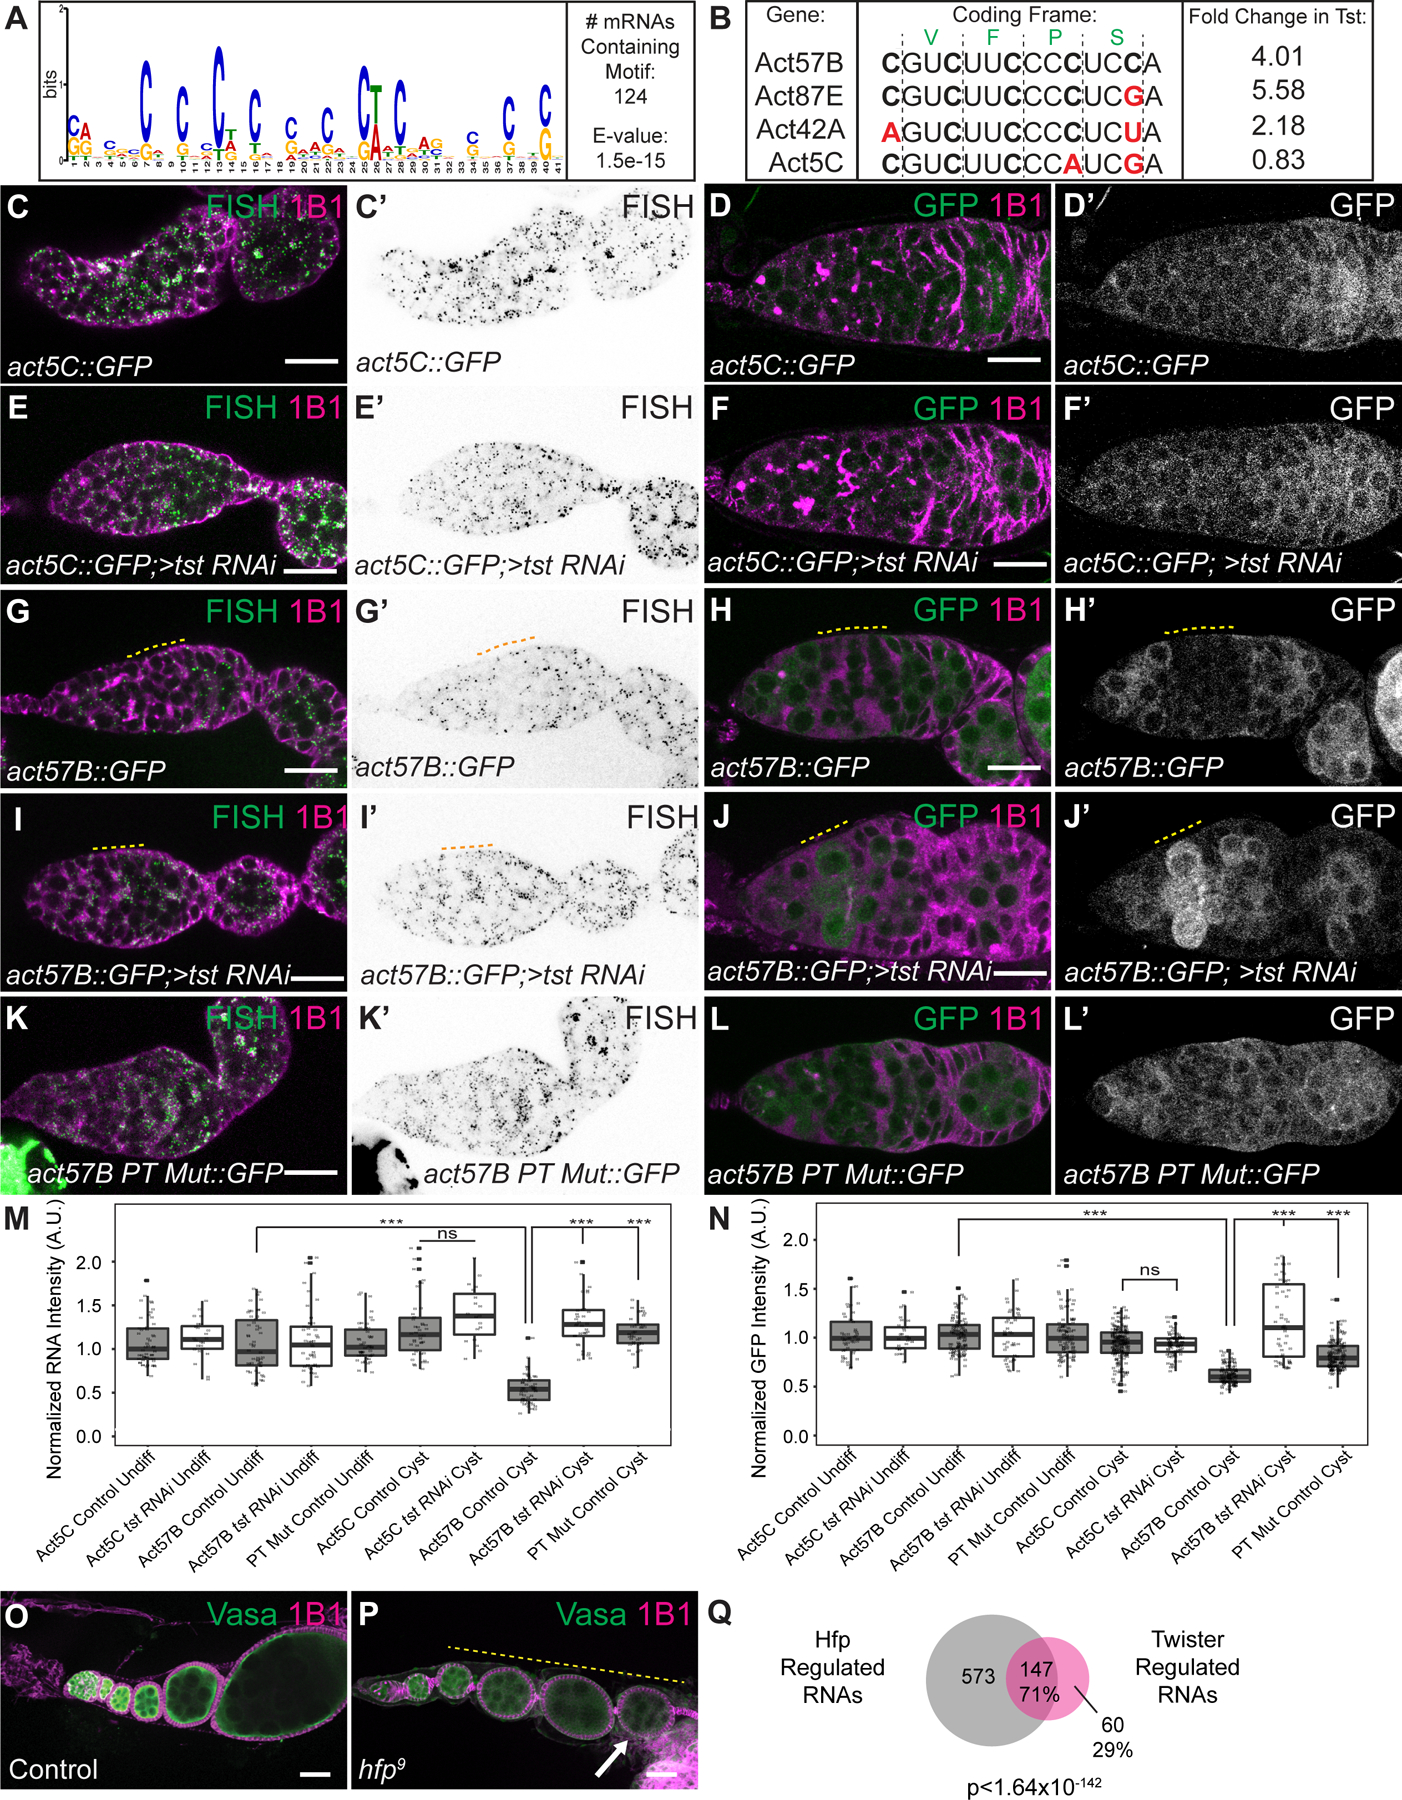
Figure 4. Twister-regulated RNAs are regulated by polypyrimidine rich sequence in their CDS and are regulated by Half Pint.

(A) Sequence logo of the polypyrimidine-rich motif identified by MEME to be enriched in the CDS of 124 Tst-regulated RNAs. (B) CDS alignment of Tst-regulated RNAs act57B and act87E, as well as act42A that is sensitive to tst, and non-target paralog act5C, showing divergent polypyrimidine-rich tracts (PTs). Black vertical lines indicate coding frame with amino acid symbols above. Fold-change increase in tst RNAi ovaries over WT is shown to the right. (C–L’) in situ hybridization and GFP fluorescence of reporters (green, grayscale) and 1B1 staining (magenta) in germaria. act5C::GFP in situ (C–C’) and GFP protein (D–D’) show uniform expression and do not change upon loss of tst (E–F’). act57B::GFP in situ (G–G’) and GFP protein (H–H’) expression are decreased in WT cyst stages (yellow dashed line) but expression is expanded into the cyst upon loss of tst (I–J’). act57B::GFP fusion with mutated PT shows ubiquitous expression in WT (K–L’). (M) Quantification of reporter RNA in situ intensity in undifferentiated cells and cyst stages (n=19–54 per cell type). *** = p < 0.001, Tukey’s post-hoc test. (N) Quantification of GFP intensity in undifferentiated cells and cyst stages (n=28–207 per cell type). *** = p < 0.001, Tukey’s post-hoc test. A.U. = arbitrary units. (O) Confocal image of control and (P) hfp9 mutant ovariole stained with 1B1 (magenta) and Vasa (green) showing egg chambers that do not grow in size (yellow dashed line) and dying egg chamber (arrow). (Q) Venn diagram of Tst-regulated RNAs and Hfp regulated RNAs indicating that Tst and Hfp share 71% (147/208) of their target RNAs (p < 1.64×10−142, Hypergeometric Test). Scale bars = 10µm. See also Figure S4, Data S1 and S2.
