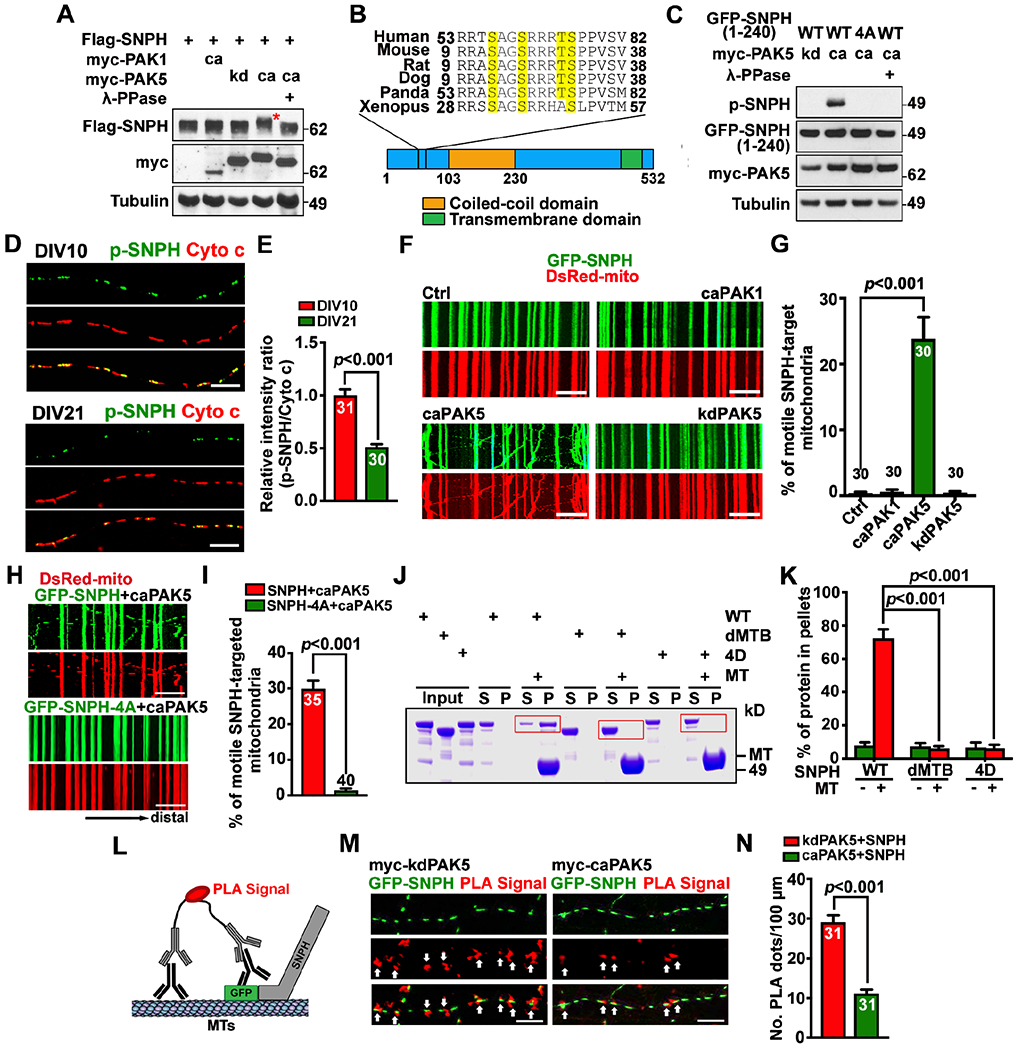
Figure 4. PAK5 signaling remobilizes axonal mitochondrial by phosphorylation of SNPH.

(A and B) PAK5 mediates phosphorylation of SNPH. SNPH band-shift (red asterisk) is indicative of clustered phosphorylation (A). Evolutionarily conserved PAK5 phosphorylation sites (yellow) are clustered at the N-terminus of SNPH and confirmed by mass spectrometry (B).
(C) An anti-p-SNPH antibody detects caPAK5-induced phosphorylation of SNPH.
(D and E) Declined p-SNPH levels on axonal mitochondria with neuron maturation from DIV10 to DIV21. The mean integrated intensity ratio of p-SNPH/Cyto c on individual mitochondria was quantified and normalized to DIV10.
(F-I) Activating PAK5 remobilizes SNPH-anchored axonal mitochondria (F, G) but fails to remobilize mitochondria anchored by phosphorylation-dead SNPH-4A (H, I) in mature cortical neurons. Time-lapse imaging was recorded for 90 frames with 5-sec intervals at DIV10.
(J and K) MT spin-down assays (n=3). After centrifugation, the supernatant (S) and pellets (P) were analyzed by SDS-PAGE and Coomassie Blue staining. Red boxes indicate SNPH.
(L-N) The proximity ligation assay (PLA) shows disrupted SNPH-MT association by PAK5 activation. Arrows mark red fluorescent signals representing in situ SNPH-MT association along axons. The number of PLA signals per 100-μm axon length was quantified.
Data were quantified from n=30-40 neurons (E, G, I, N) per condition as indicated within bars from three experiments, expressed as mean±SEM, and analyzed by Student’s t test (E, I, N) or one-way ANONA with Dunnett’s multiple comparisons test (G, K). Scale bars, 10 μm. (See also Figures S3, S4)
