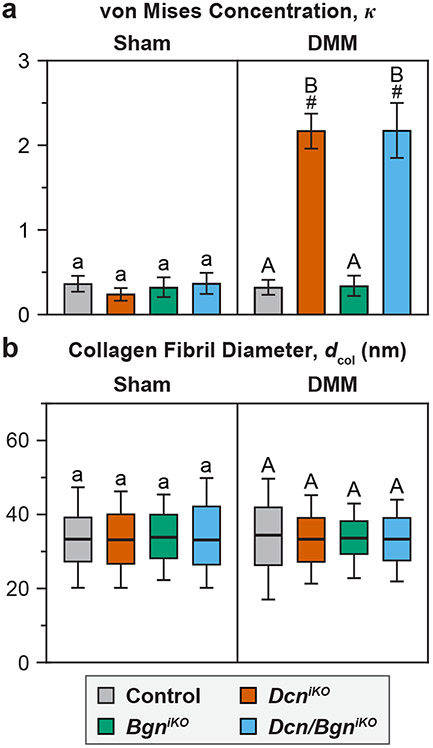
Figure 4.
a) Degree of fibril alignment, as denoted by the von Mises concentration parameter κ, and b) Distribution of collagen fibril diameter, dcol, for all four genotypes at 8 weeks after Sham and DMM surgeries. Results are from ≥ 300 fibrils pooled from n = 4 animals per group. Different letters indicate significant differences between genotypes for each surgery type, #: p < 0.05 between Sham and DMM surgeries for each genotype. Data for control and DcniKO mice in panel a) are adapted from Ref. 15 with permission.

