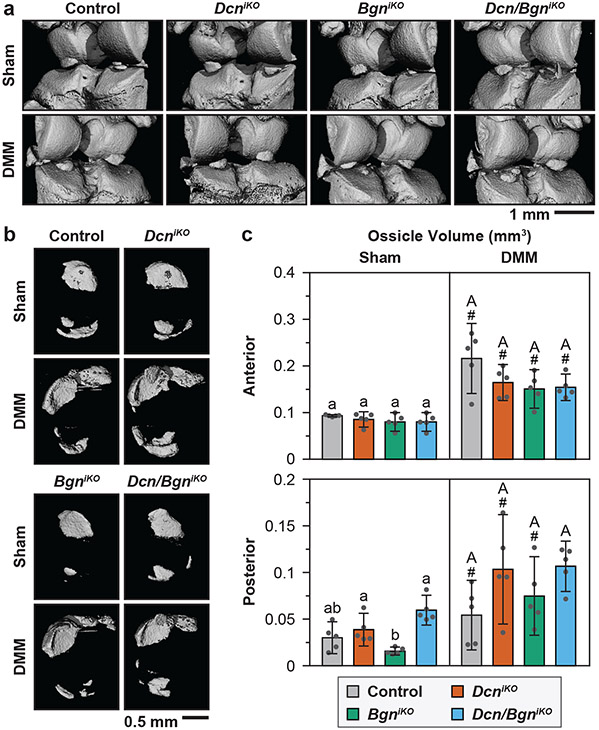
Figure 7.
a) Representative reconstructed 3D μCT images showing the presence of osteophyte in both DcniKO and Dcn/BgniKO joints at 8 weeks after DMM (white arrowheads), but not in other groups. b) Representative reconstructed 3D μCT images (top view) of meniscal ossicles showing increased ossification after DMM for all genotypes. c) Meniscal ossicle volume at both anterior and posterior ends at 8 weeks after Sham and DMM surgeries. Panel c: mean ± 95% CI, n = 5, each data point represents the averaged value measured from one animal. Different letters indicate significant differences between genotypes for each surgery type, #: p < 0.05 between Sham and DMM surgeries for each genotype. Data for control and DcniKO mice are adapted from Ref. 15 with permission.

