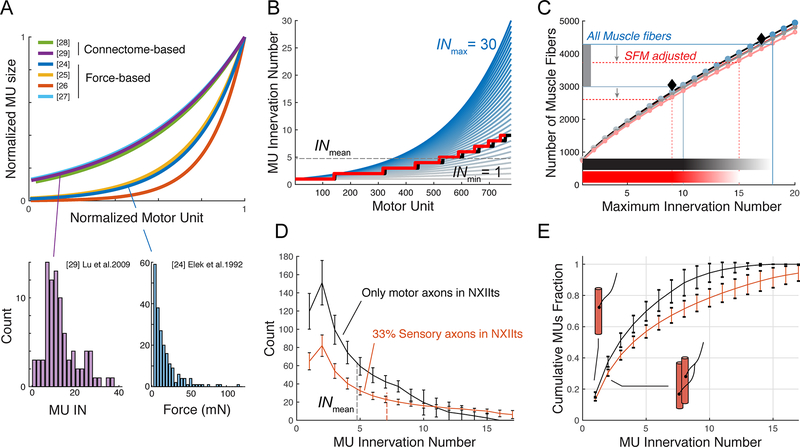
Figure 2. MU size distribution models predict one-to-one innervation in the songbird syrinx motor pool.
A) MU size distributions are skewed towards small units (bottom) and exponential in both anatomical connectome reconstructions and force-based measurements (top, and Figure S1). B) IN distribution as function of MU with INmax ranging from 1 (gray) to 30 (blue). Black lines indicate the average INmean (horizontal dotted line) and distributed IN (stepped line) for the individual with the smallest INmean (3.84). The red line (also next panel) indicates the distribution for only superfast muscle fibers. See also Figure S2. C) The number of muscle fibers (horizontal lines) provides INmax per individual. Colors correspond to INmax lines in panel B. Shown are the individuals with smallest (3.84, gray) and largest INmean (5.67, blue). Shaded horizontal bars indicate IN range. D) Distribution and E) cumulative fraction of MU as a function of IN for superfast fibers with 0% (black line) or 33 % (orange line) adjustment for afferent sensory axons. Data presented as mean ± SD.

