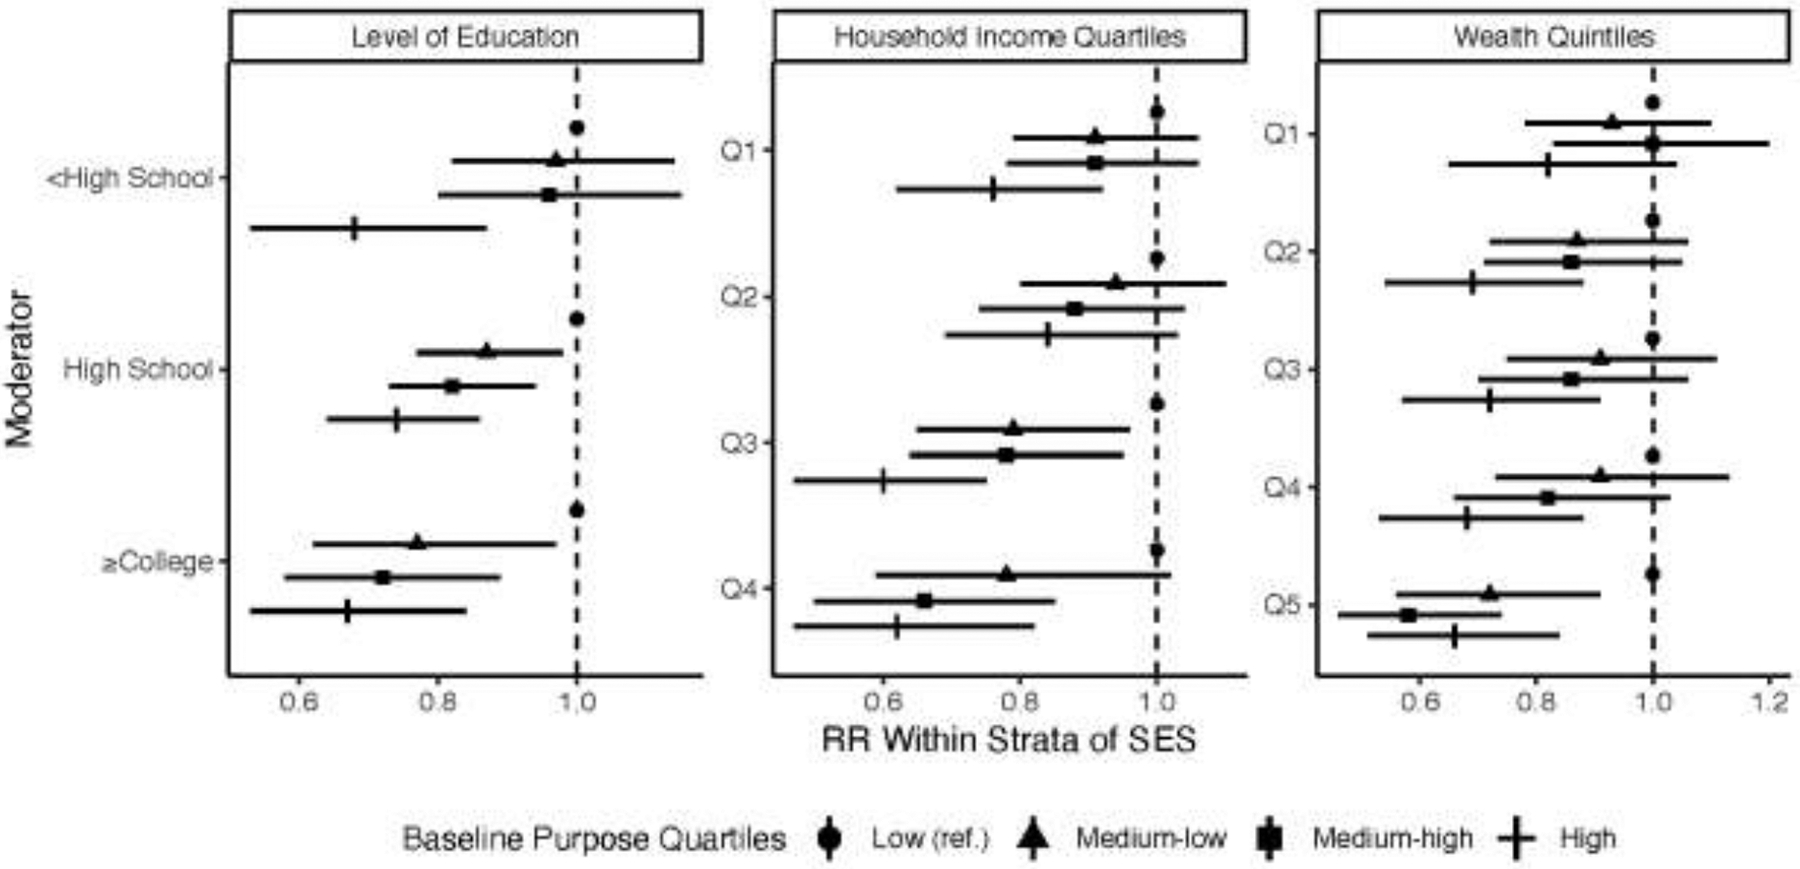
Figure 1.

Associations between baseline purpose in life and 8-year mortality within strata of educational attainment, income quartiles, and wealth quintiles.a,b,c,d
aRRs were adjusted for: age, gender, race/ethnicity, marital status, health insurance, heart disease, stroke, cancer, diabetes, hypertension, lung disease, arthritis, and depression using Poisson regression. Each model was further adjusted for the other two SES indicators (e.g., income and wealth for the education model).
bPurpose in life was assessed using the purpose in life subscale of the Ryff Psychological Well-being Scales. Purpose in life quartiles: low: 1.00–3.86; medium–low: 3.87–4.57; medium–high: 4.58–5.29; high: 5.30–6.00.
cHousehold income quartiles: 1st quartile: ≤$20,024; 2nd quartile: $20,025–$38,321; 3rd quartile: $38,322–$71,895; 4th quartile: ≥$71,896.
dWealth quintiles: 1st quintile: ≤$35,000; 2nd quintile: $35,001–$140,000; 3rd quintile: $140,001–$311,000; 4th quintile: $311,001–$652,500; 5th quintile: ≥$652,501.
RR, risk ratio.
