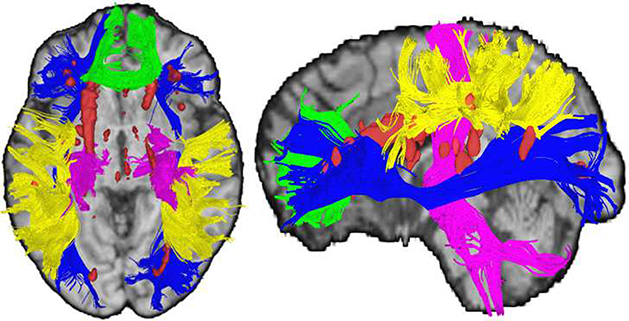
Figure 1: White Matter Measures.
Axial and sagittal views illustrating white matter tracts resolved using deterministic tractography (green = corpus callosum genu; blue = inferior frontal occipital fasciculus; yellow = superior longitudinal fasciculus; pink = corticospinal tract) and white matter hyperintense regions (red = white matter hyperintense voxels) in a participant with an average number of white matter streamlines in each tract and both within-tract and whole brain white matter hyperintensity burden (+/− .5 SD).

