
Fig. 5. Kiss1 expression is reduced in the AVPV of E2-treated Vax1KissCre females.
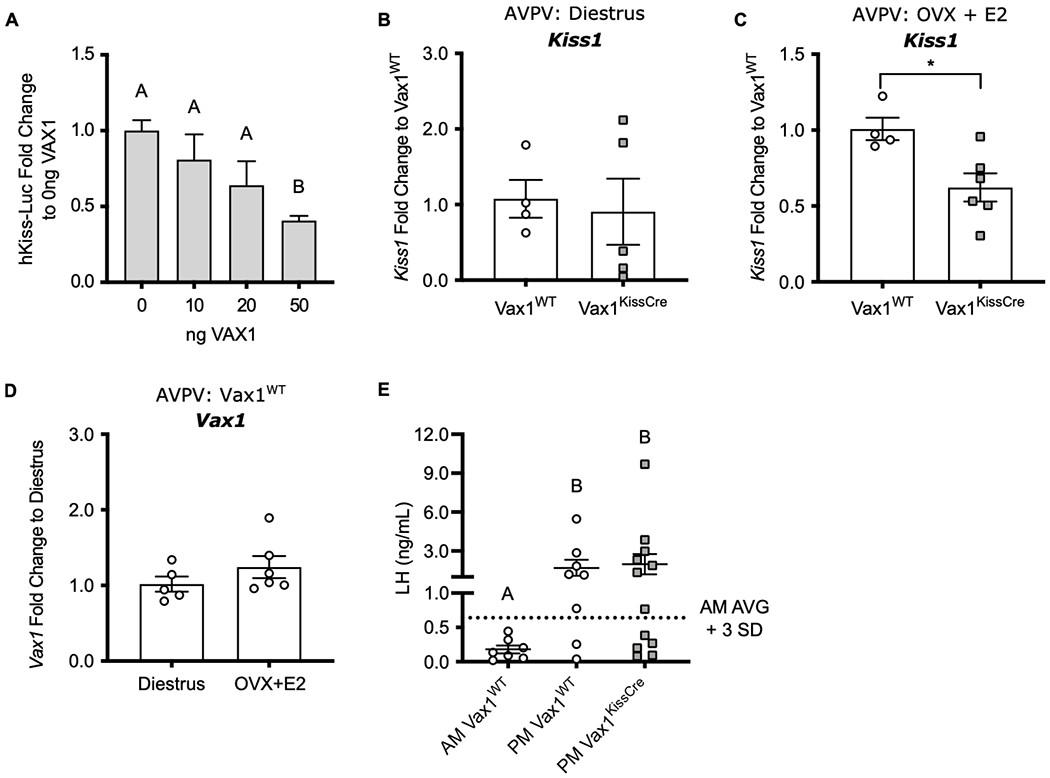
(A) hKiss-Luc or pGL2 was co-transfected with increasing concentrations of VAX1 expression vector into KTaV-3 cells. hKiss-Luc values were normalized to pGL2 values and represented as fold change compared to 0 ng VAX1. Values represent means ± SEM. N=4. RT-qPCR of Kiss1 in the AVPV of (B) diestrus-staged female mice collected at ZT 4-7 and (C) OVX + E2 treated females collected at ZT 12-13. (D) RT-qPCR of Vax1 from the AVPV of intact diestrus-staged Vax1WT collected at ZT 4-7 or OVX + E2-treated Vax1WT females collected at ZT 4-5. qPCR data were analyzed by the 2^-delta delta Ct method and represented as fold change compared to (B, C) Vax1WT or (D) Diestrus ± SEM. (E) Serum LH levels from OVX+E2 treated females, collected at ZT 4-5 (AM) or at ZT 12-13 (PM). Dotted line indicates surge threshold (AM average + 3 SD = 0.64 ng/mL), N=7-12. Data were analyzed using (A, E) One-way ANOVA or (B-D) Student’s t-test. Different letters or * indicate significance of p<0.05.