
Figure 2. High-dimensional single-cell characterization of pMIG- and BATF-transduced CAR TILs by mass cytometry (CyTOF).
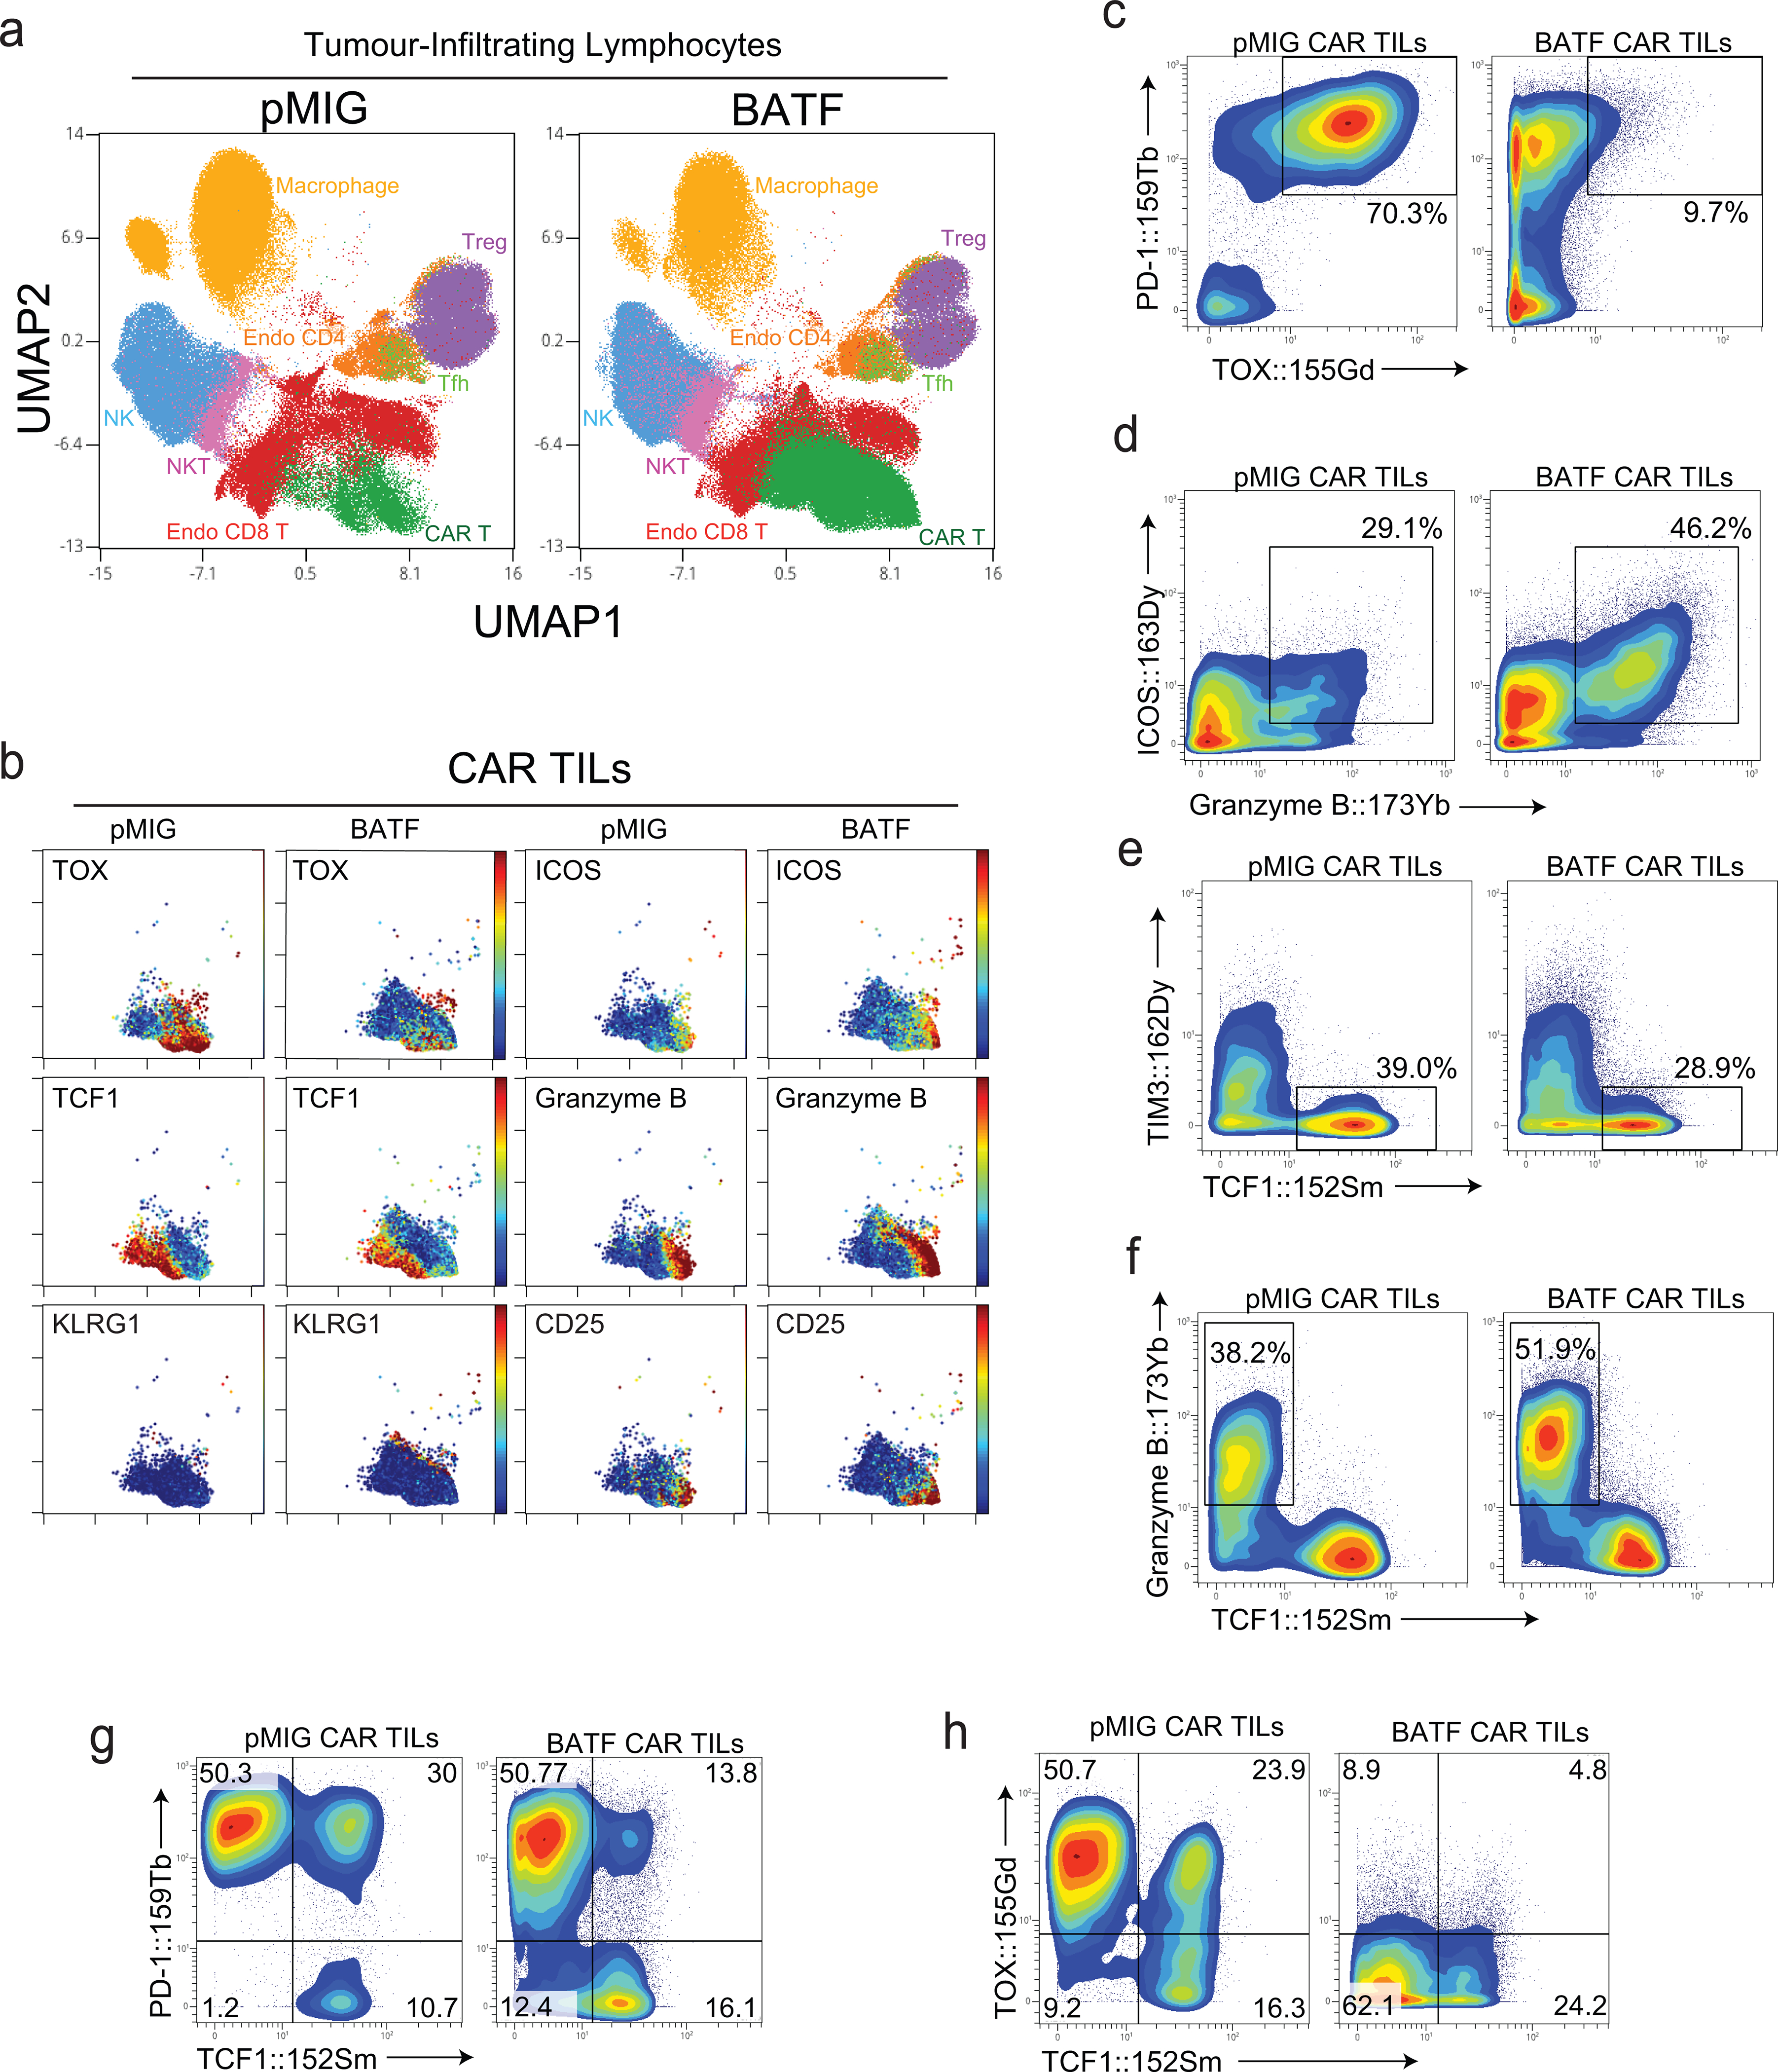
a-h, 1×10⁵ B16F0-hCD19 tumor cells were injected subcutaneously into the left flank of C57BL/6 mice at day 0 (D0). 1.5×10⁶ pMIG- or BATF-transduced CAR T cells were adoptively transferred at day 12. TILs were isolated at day 20 and stained with metal-conjugated antibodies for mass cytometry, performed at day 21 using a CyTOF mass spectrometer. The gating strategy is detailed in Extended Data Fig. 3a.
a, Plots show UMAP views that provide comprehensive single-cell analysis and distinguish TIL subpopulations.
b, Detection of indicated markers on pMIG or BATF CAR TILs is visualized by UMAP.
c-h, Contour plot of indicated markers on pMIG or BATF CAR TILs.
Data are representative of two biological experiments. Each group of samples was pooled from 10 mice.