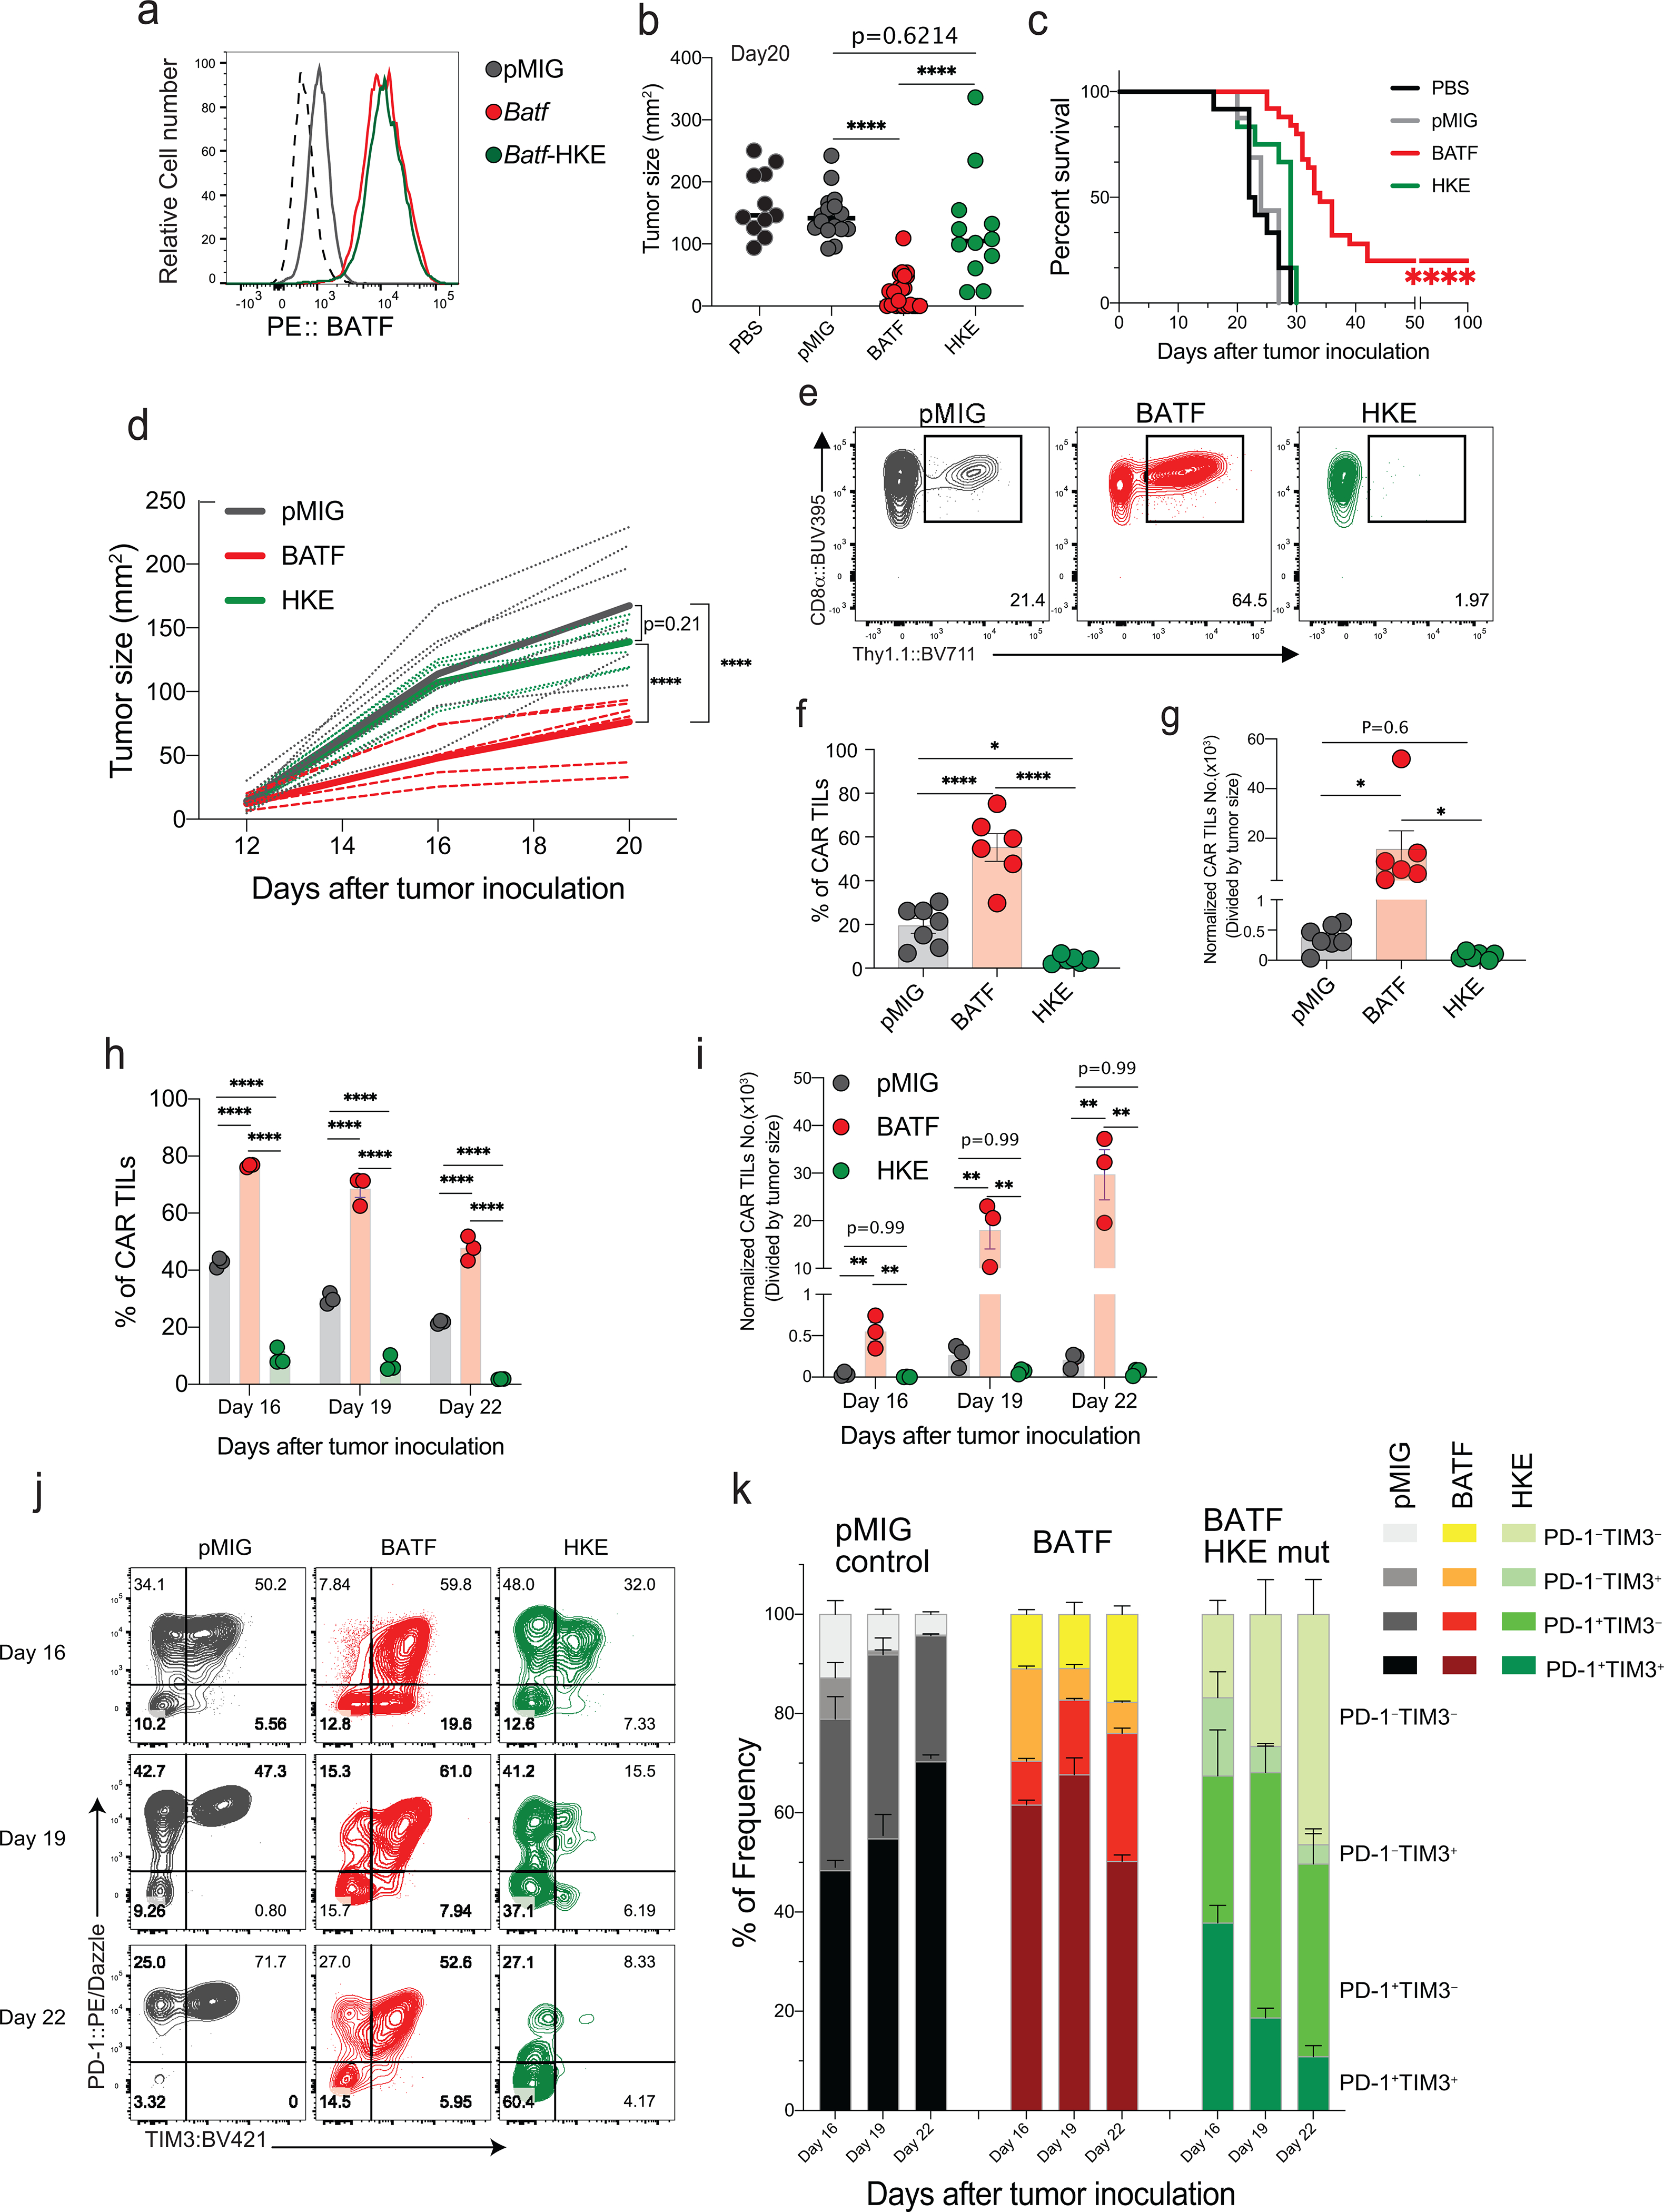
Figure 4. The BATF-IRF interaction is required for CAR T cell survival, expansion, and anti-tumor responses.

a, Expression of endogenous BATF in pMIG-transduced cells, and of BATF and BATF-HKE in retrovirally transduced CD8+ T cells.
b-c, Experimental protocol as in Fig. 1a–c.
b, Tumor sizes in individual mice at day 20.
c, Survival curves. Data for PBS, pMIG, and BATF are replotted from Fig. 1c, since the BATF-HKE mutant (n=12) was analyzed in the same experimental series.
d-g, Experimental protocol as in Fig. 1d–i, except with pMIG(n=7)-, BATF(n=6)-, or BATF-HKE(n=6)-transduced CAR T cells.
d, Tumor growth curves for individual mice (dashed lines) and the averages for all mice in a group (bold lines).
e, Representative contour plots of CD8α and Thy1.1 expression in the isolated TILs. The Thy1.1 reporter marks CAR T cells.
f, Percentage of CAR TILs among CD8+ T cells.
g, Number of CAR TILs normalized to tumor size.
h-k, 1×10⁵ B16F0-hCD19 tumor cells were injected subcutaneously into the left flank of C57BL/6 mice at day 0 (D0), and indicated CAR T cells were adoptively transferred by retro-orbital injection on day 12. TILs were isolated on Days 13, 16, 19, and 22. No CAR TILs were observed on day 13, one day after adoptive transfer.
h,i, Percentages of CAR TILs (h) and normalized numbers of CAR TILs (i) on the indicated days.
j, Representative contour plots of PD-1 and TIM3 expression on the CAR TILs, assessed by flow cytometry.
k, Frequencies of the indicated PD-1- and TIM3-expressing populations.
Each circle in b, f, g, h, and i represents one mouse, and the bar graphs represent the mean ± standard error of mean (s.e.m.). Data in a and h-k are representative of two independent experiments. Data in b and c were obtained from three, and data in d-g from two, independent biological experiments. Data in b, f, and g were analyzed by one-way ANOVA test; data in c, using a log-rank Mantel-Cox test; and data in d, h, and i, by two-way ANOVA test. *p≤0.05; **p≤0.01; ***p≤0.001; ****p≤0.0001.
