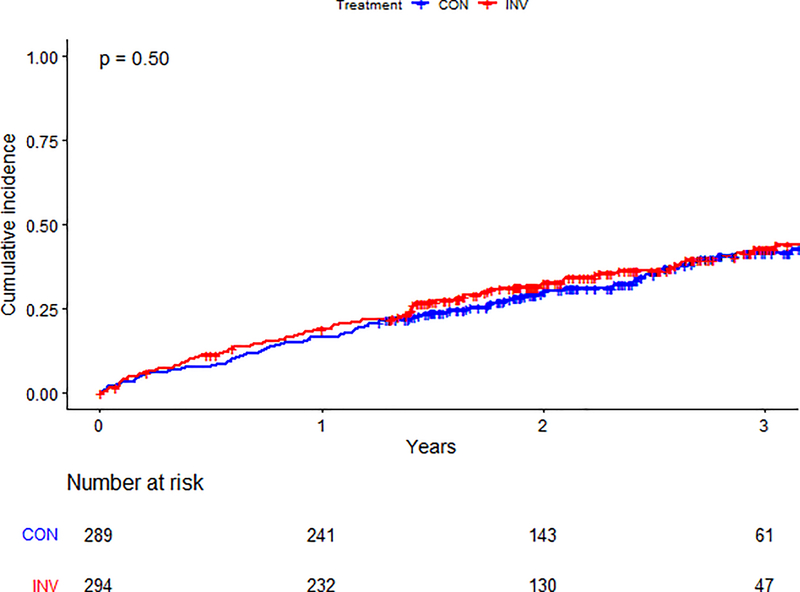
Figure 3c. Secondary outcome by treatment arm in patients not listed.
Cumulative incidence of secondary outcome between randomized treatment arms in patients not listed for kidney transplant. The blue line represents those in the conservative arm; the red line represents those in the invasive arm. Number at risk at each time point is listed below the graph. Abbreviations: CON=conservative arm; INV=invasive arm.

