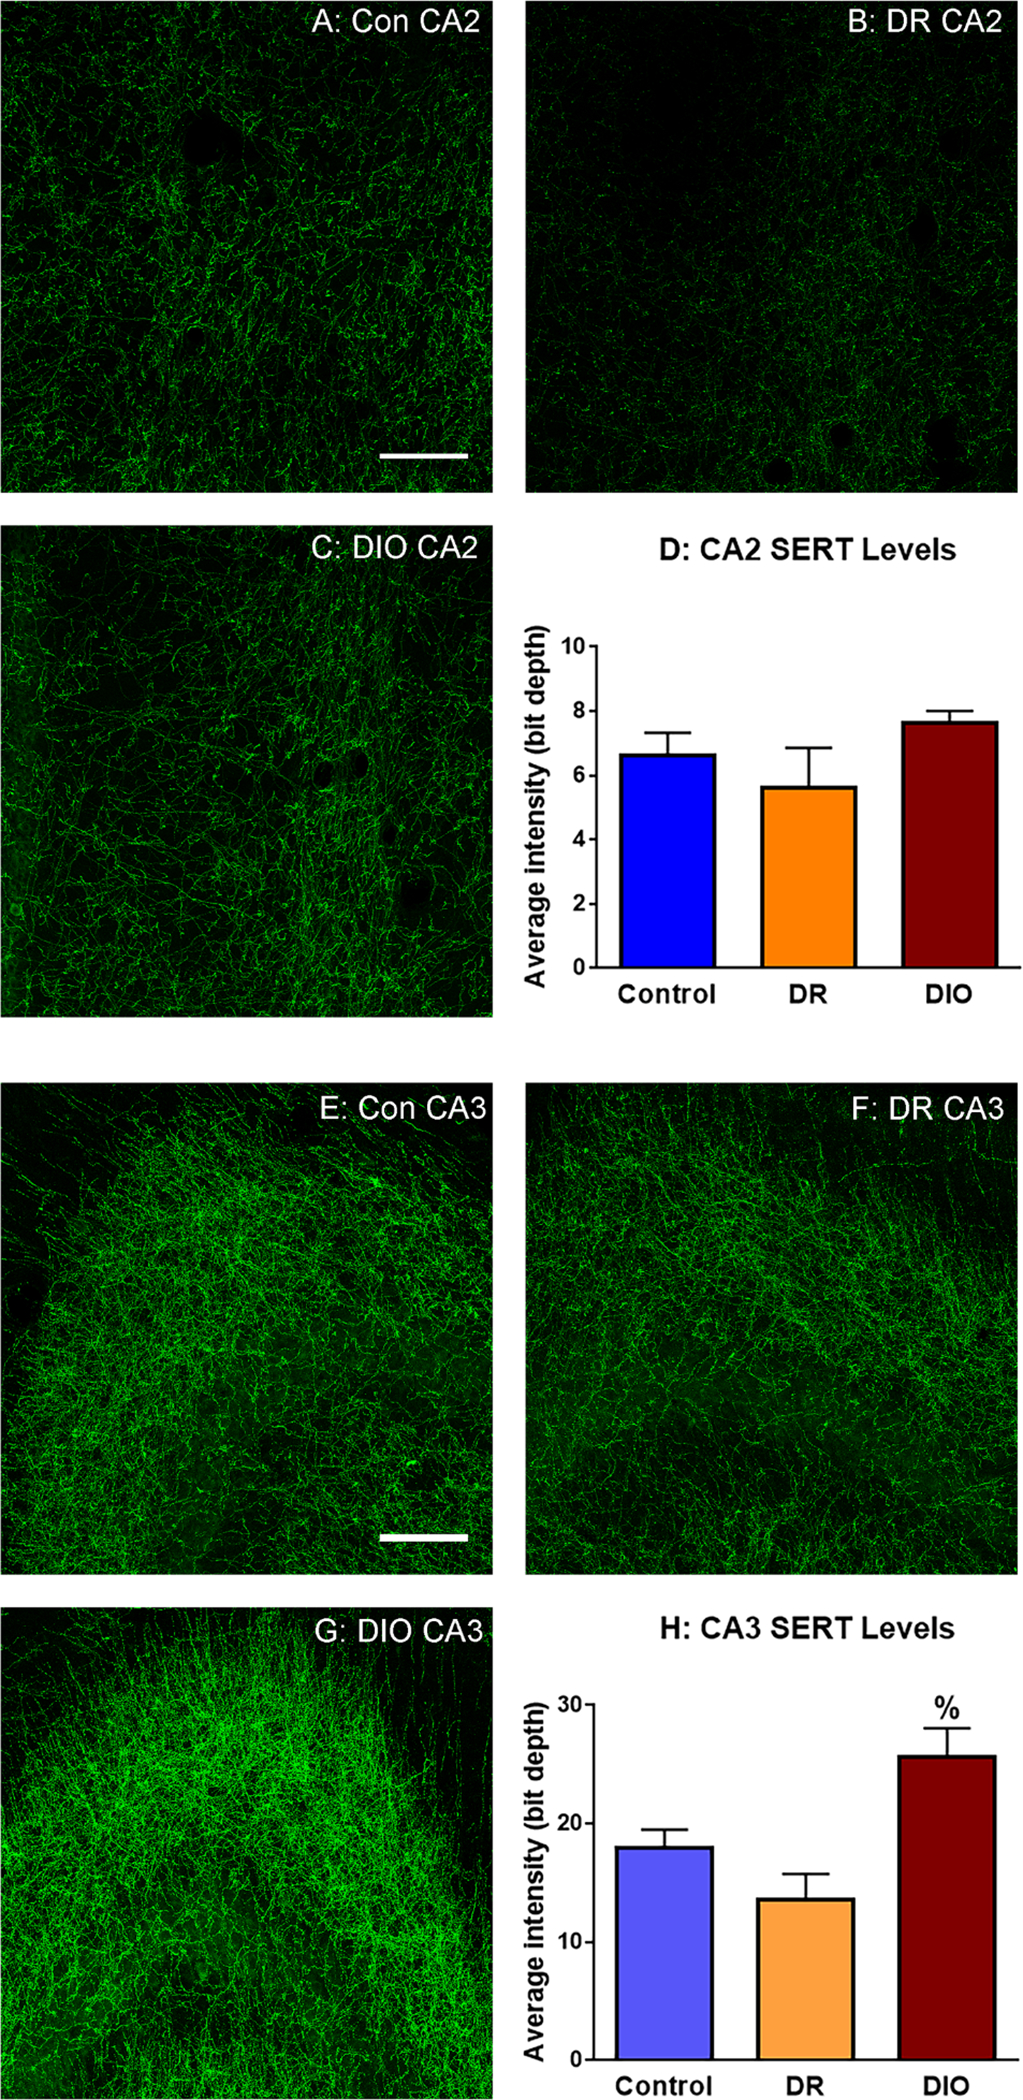
Fig. 7.

Fluorescence immunohistochemical analysis reveals that SERT expression levels are increased in the hippocampus of DIO rats. Representative images of SERT immunofluorescence in the CA2 region of the hippocampus of (A) Control rats (A: Con CA2), DR rats (B: DR CA2), and DIO (C: DIO CA2) rats. Fluorescence intensity analysis of confocal images determined that although SERT expression increased in the CA2 region of DIO rats (Panel D), these increases did not achieve statistical significance [F(2,9)=0.642; p=0.2]. Representative images of SERT immunofluorescence in the CA3 region of the hippocampus of Control rats (E: Con CA3), DR rats (F: DR CA3), and DIO (G: DIO CA3) rats. Fluorescence intensity analysis of confocal images determined that SERT expression is significantly increased in the hippocampus of DIO rats compared to DR rats (Panel H. [F(2,9)=0.619; p=0.008]. Results based on analysis of 3 images/rat and 4 rats per group; scale bar = 50 μm]
