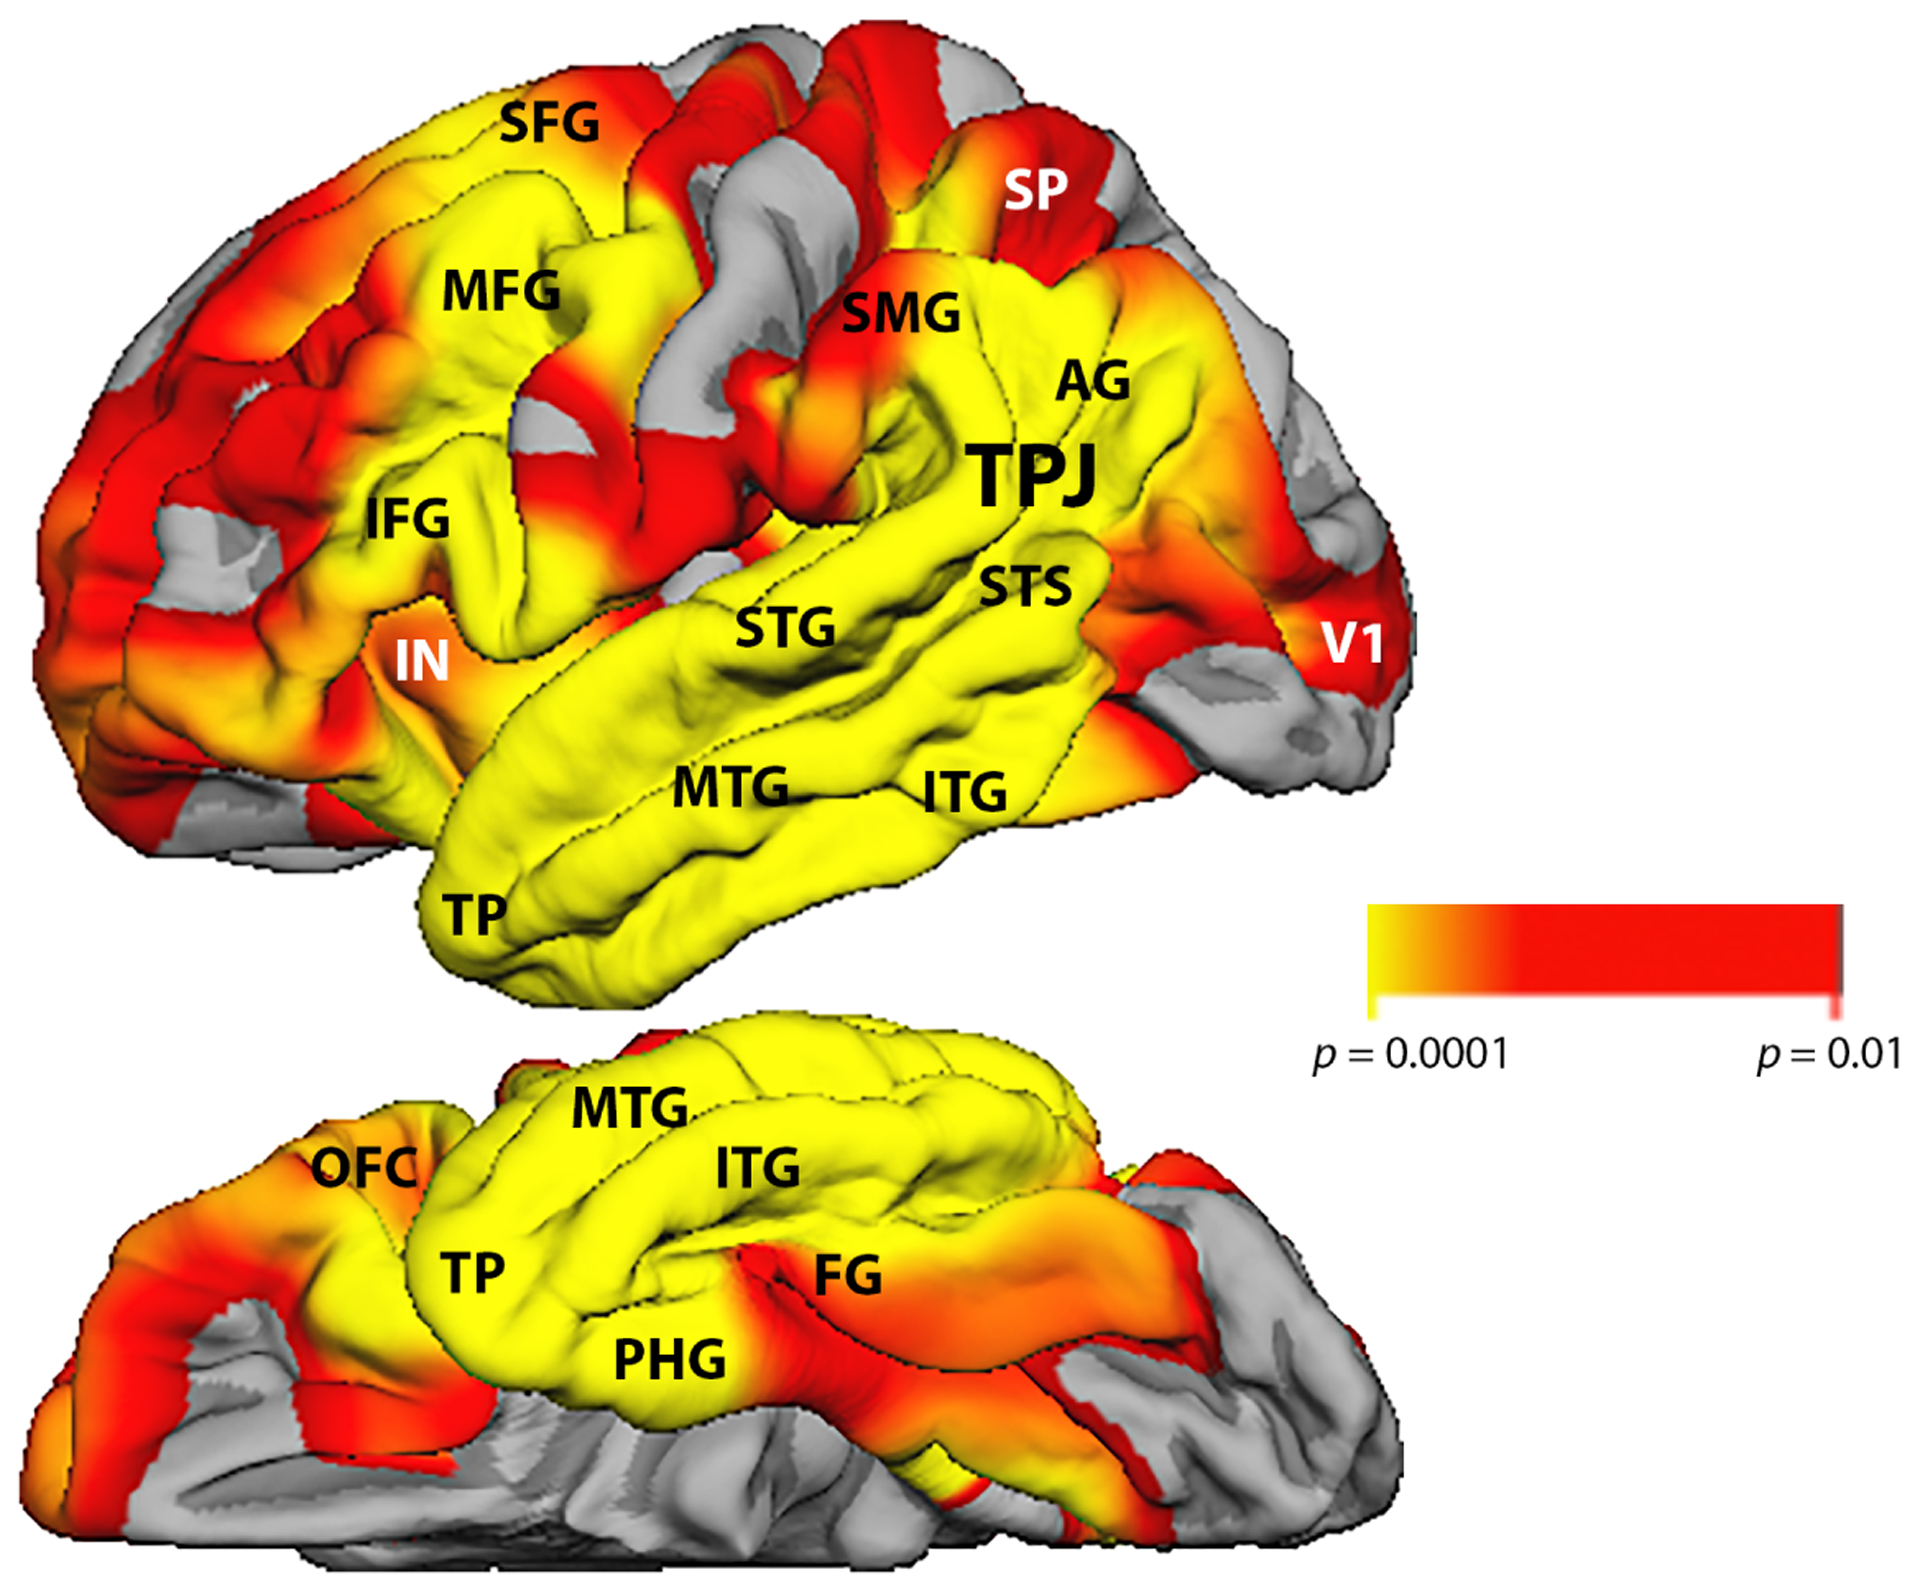
Figure 1-.

Composite atrophy map for the entire full cohort of 62 PPA participants. Cortical thickness maps of the PPA participants were statistically contrasted against 35 previously described right-handed cognitively healthy volunteers with a similar range of age- and education to identify peak patterns of atrophy. The color scale reflects significance levels. Lateral view of the left hemisphere is on top, and ventral view on the bottom. Abbreviations: AG- angular gyrus; FG- fusiform gyrus; IFG- inferior frontal gyrus; IN- insula; ITG- inferior temporal gyrus; MFG- middle frontal gyrus; MTG- middle temporal gyrus; OFC- orbitofrontal cortex; PHG- parahippocampal gyrus; SFG- superior frontal gyrus; SMG- supramarginal gyrus; SP- superior parietal lobule; STG: superior temporal gyrus; STS- superior temporal sulcus; TP- temporopolar cortex; TPJ- temporoparietal junction; V1- primary visual cortex.
