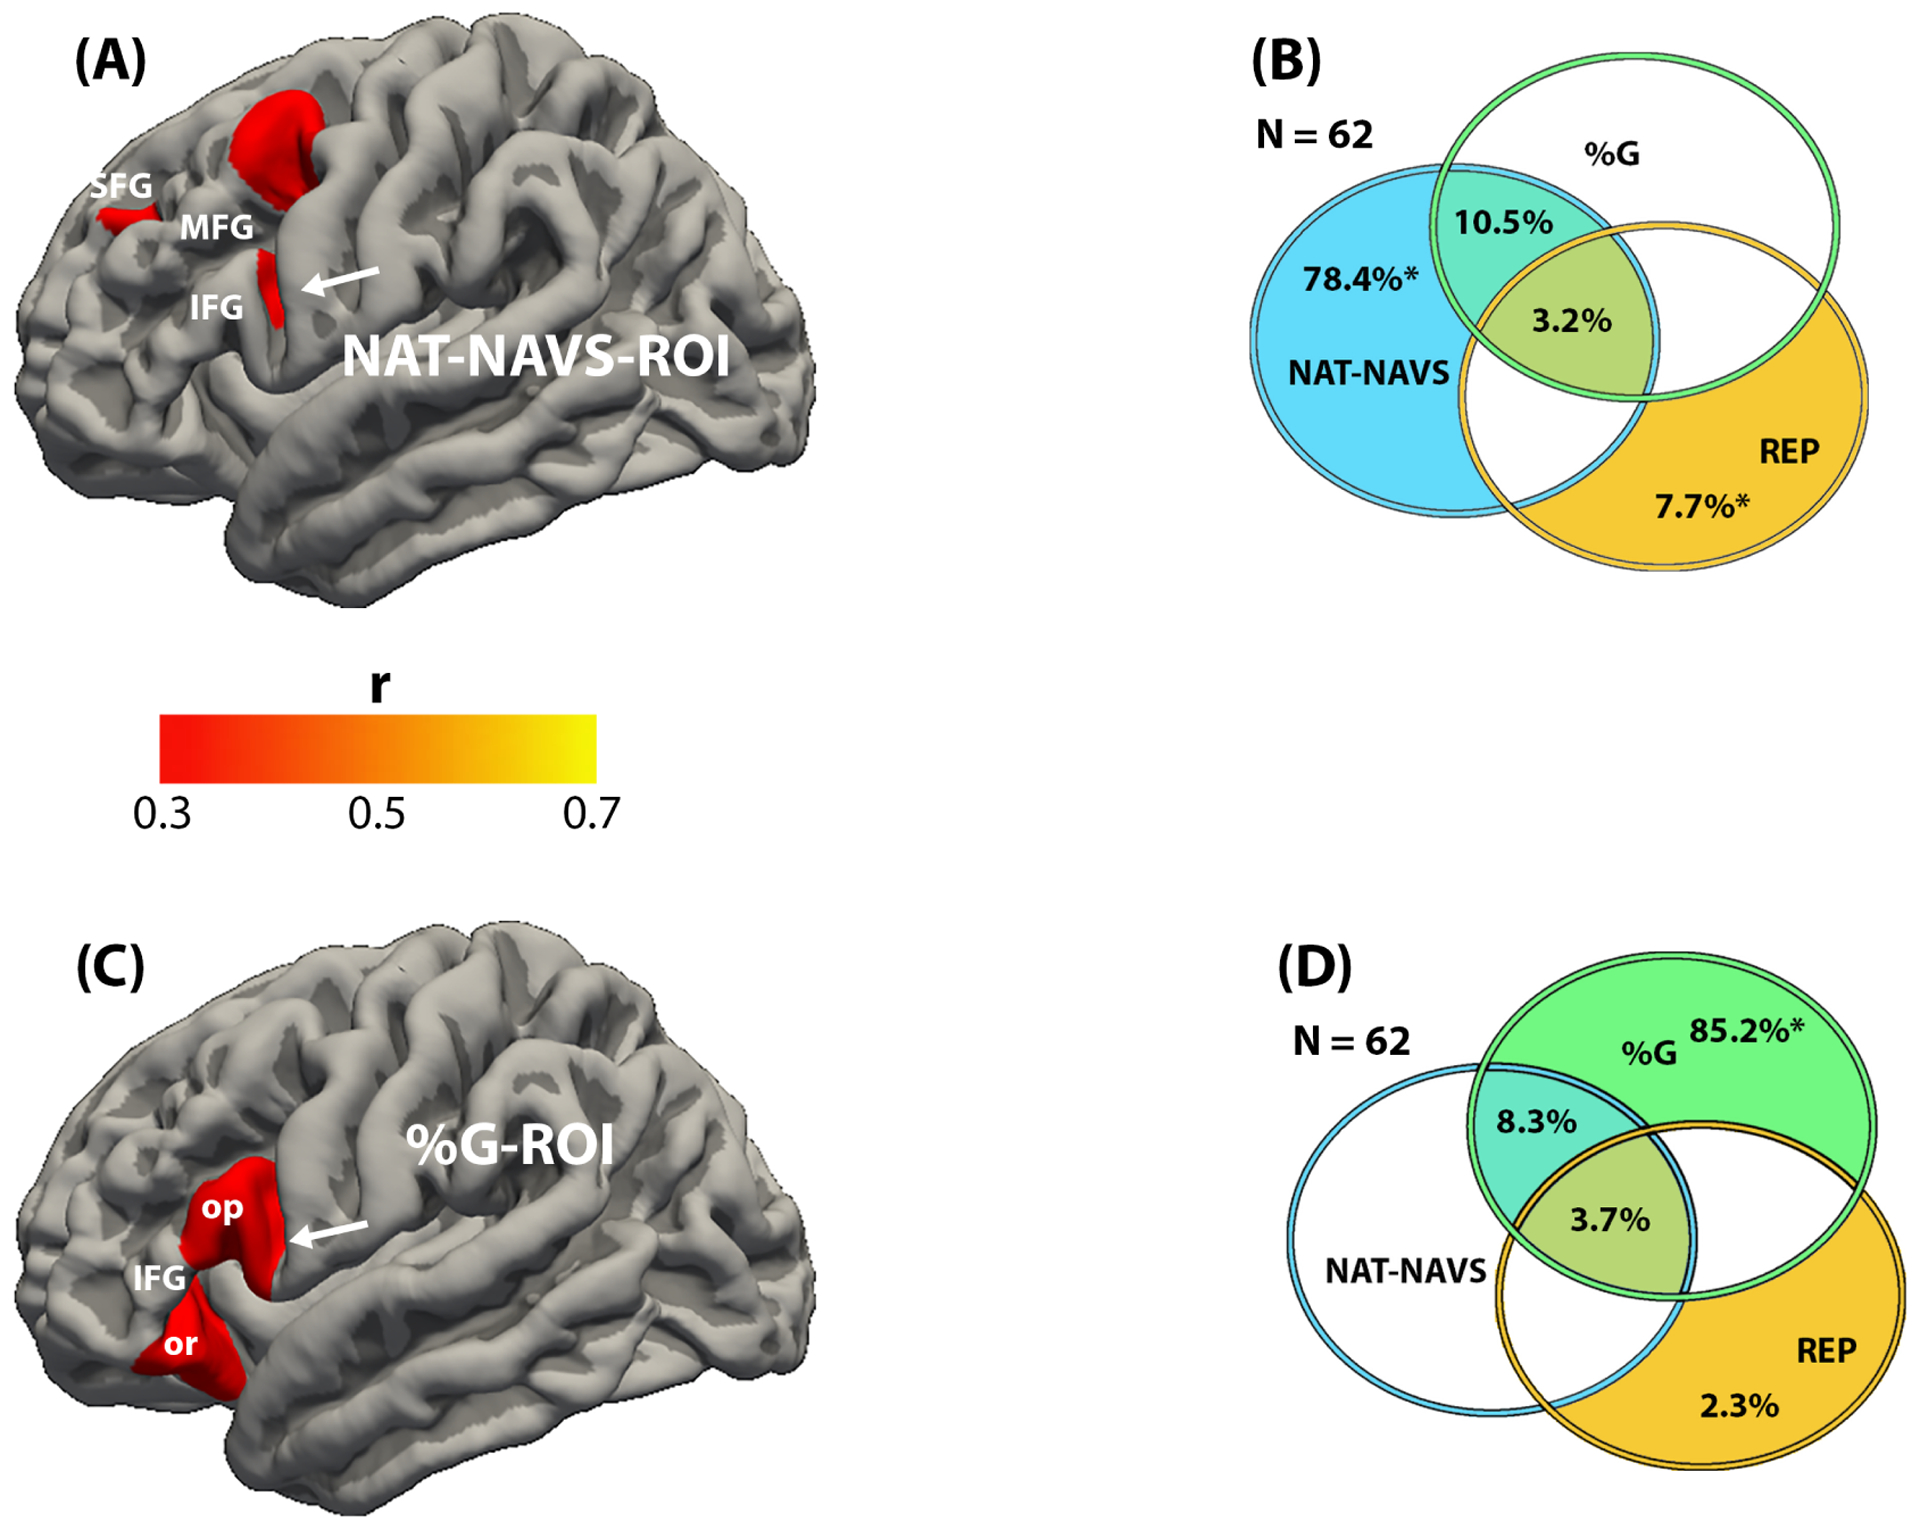
Figure 2 -.

Results of the regression (A, C), and commonality (B, D) analyses in the cohort of 62 PPA participants. A. The areas in red indicate regions where cortical thinning (atrophy) was correlated with impaired performance on the NAT-NAVS test of syntactically correct sentence construction (r range 0.3–0.412). These areas are collectively designated NAT-NAVS-ROI. The heat map indicates the scale used to illustrate significance levels. B. Commonality analysis indicates the task-specific unique and shared contributions to the explained variance of thickness in the NAT-NAVS-ROI. Each circle reflects the contribution of a specific task, blue for NAT-NAVS, green for %G, gold for REP. The numbers represent the contribution of a specific task or of a combination of tasks to the explained variance of thickness within the ROI. Overlapping areas represent shared contributions. Those with an asterisk were statistically significant. Absence of detectable contribution to variance of ROI thickness is indicated by the uncolored spaces. The figure offers a conceptual illustration of the results but is not drawn to scale so there is no correspondence between the magnitude of contributions and the size of the areas encompassed by overlapping or non-overlapping parts of the circles. C. The red areas indicate regions where cortical thinning (atrophy) was correlated with impaired performance on the %G score of grammatically correct sentences in speech (r range 0.3–0.397). These areas are collectively designated %G-ROI. The heat map indicates the scale used to illustrate significance levels. The arrows in A and C indicate the small region of overlap between the two ROI. D. Commonality analysis indicates the task-related unique and shared contributions to the explained variance of thickness in the %G-ROI. Each circle reflects the contribution of a specific task, blue for NAT-NAVS, green for %G, gold for REP. The numbers represent the percentage of contribution to the explained variance of the ROI. Overlapping areas represent shared contributions. Those with an asterisk were statistically significant. Absence of detectable contribution to variance of ROI thickness is indicated by the uncolored spaces. The figure offers a conceptual illustration of the results but is not drawn to scale so there is no correspondence between the magnitude of contribution and the areas encompassed by overlapping or non-overlapping parts of the circles. Abbreviations: %G- percentage of grammatically correct sentences in running speech; IFG- inferior frontal gyrus; MFG- middle frontal gyrus; NAT-NAVS- test of syntactically correct sentence construction; op- opercularis component of IFG; or- orbitalis component of IFG; REP- test of language repetition; SFG- superior frontal gyrus.
