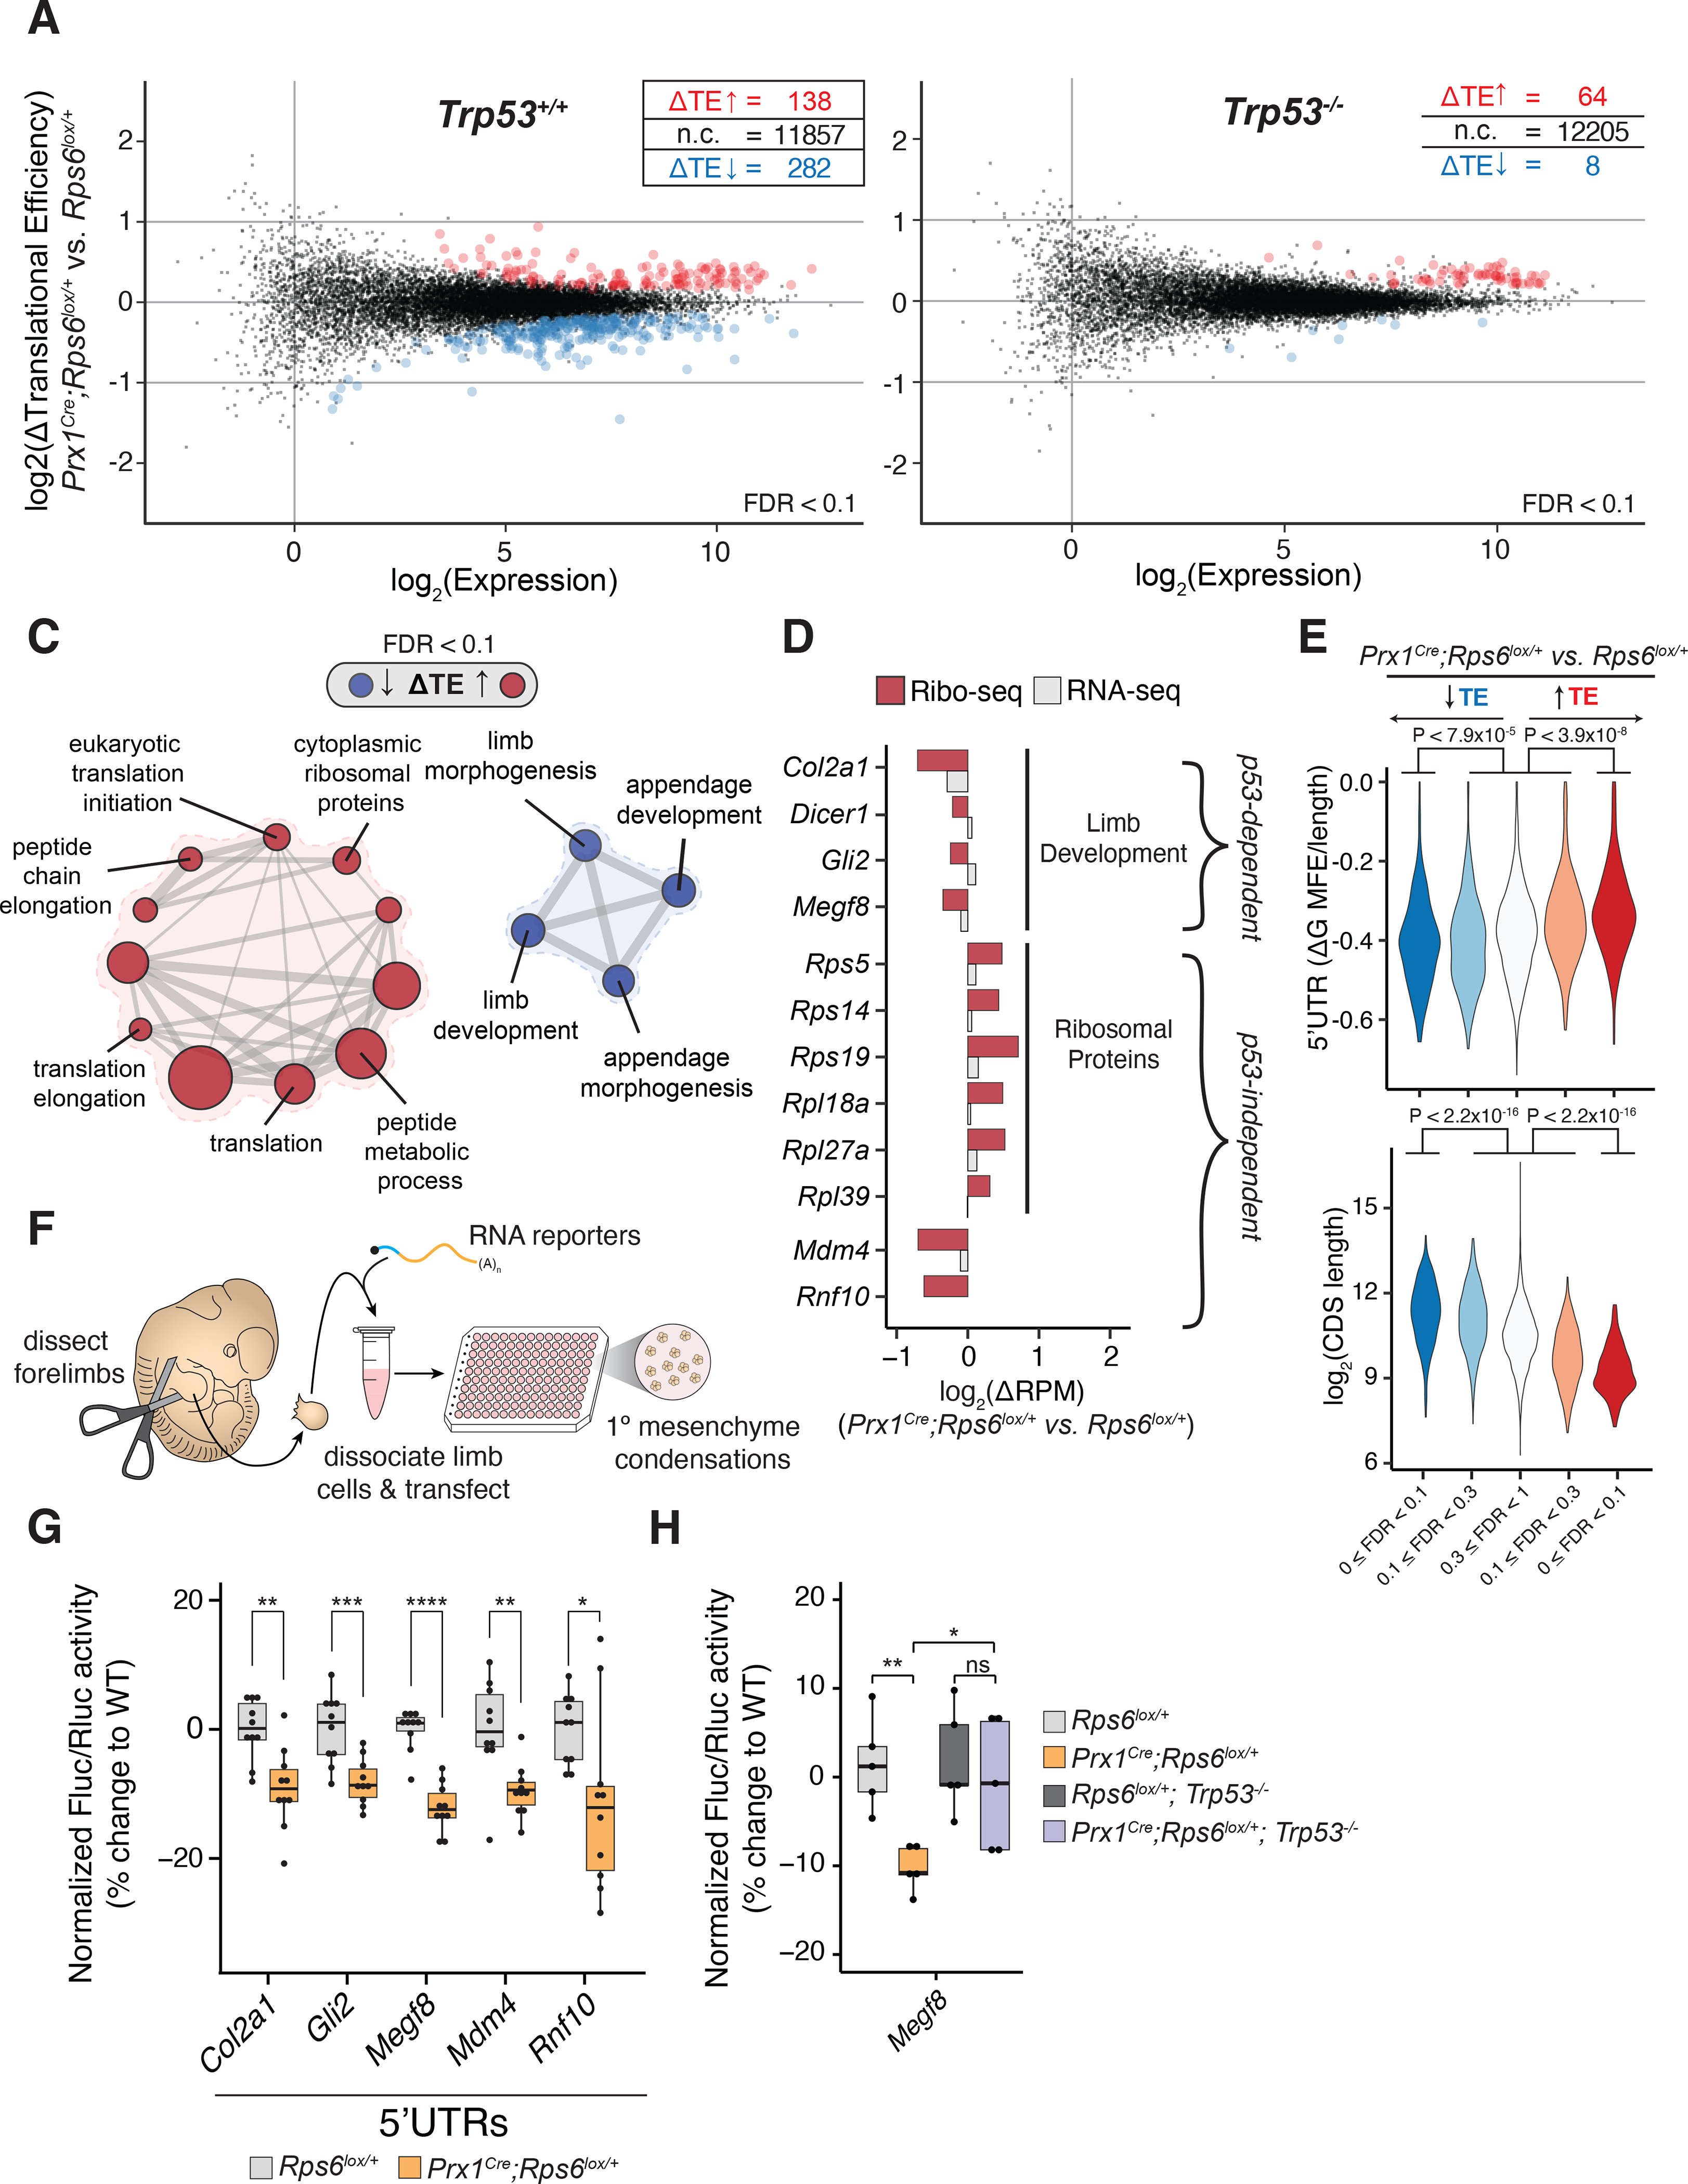
Figure 4. Ribosome profiling reveals p53-dependent and -independent translation changes upon Rps6 haploinsufficiency.

(A-B) MA plot of change in translational efficiency (ΔTE) in whole E10.5 Prx1Cre;Rps6lox/+ vs. Rps6lox/+ forelimbs in Trp53+/+ (A) and Trp53−/− (B) backgrounds. red, ΔTE > 0; blue, ΔTE < 0; n = 3; FDR < 0.1. (C) Gene set enrichment analysis for transcripts changing in TE in E10.5 Prx1Cre;Rps6lox/+ vs. Rps6lox/+ forelimbs. node size, gene set size; edge size, gene set overlap; FDR < 0.1.
(D) Relative change in ribosome footprints (red) and mRNA expression (gray) for select high-confidence transcripts (see Methods).
(E) Violin plots quantifying ΔTE relative to computationally predicted 5’UTR structuredness normalized to UTR length (ΔG MFE / 5’UTR length; see Methods) and relative to CDS length. Transcripts are stratified by direction of ΔTE (blue, down; red, up) and FDR; Mann-Whitney U test.
(F) Workflow of the primary limb micromass assay.
(G) Fluc/Rluc activity from RNA reporter transfection in whole E11.5 forelimb micromass cultures normalized to the geometric mean of control Pkm and Cnot10 5’UTR activities and WT (Rps6lox/+). Pkm and Cnot10 were chosen as controls given that they did not change in TE upon Rps6 haploinsufficiency (Table S3).
(H) Fluc/Rluc activity of Megf8 5’UTR RNA reporter transfected into whole E11.5 forelimb micromass cultures normalized to control Pkm 5’UTR activity and mean of WT (Rps6lox/+) or Trp53-null (Rps6lox/+;Trp53−/−) background.
