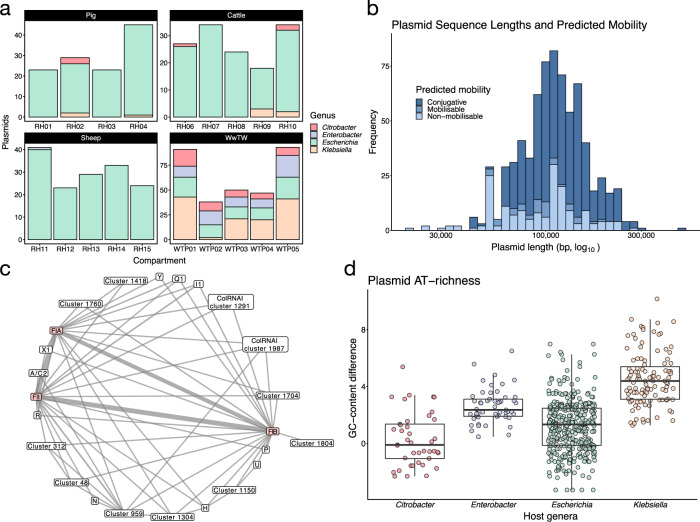
Fig. 1. Overview of plasmid population.
a Plasmid host genera distribution by compartment. b Distribution of plasmid sequence lengths with predicted mobilities. c Graph representing the association between replicon alleles. F-type nodes are coloured pink. Line weight is proportional to frequency of association in the sample. d Plasmid GC-content subtracted from host chromosome GC-content. A value greater than zero indicates the plasmid is AT-richer than the host. Only plasmids with circularised host chromosomes were used (565/726).

