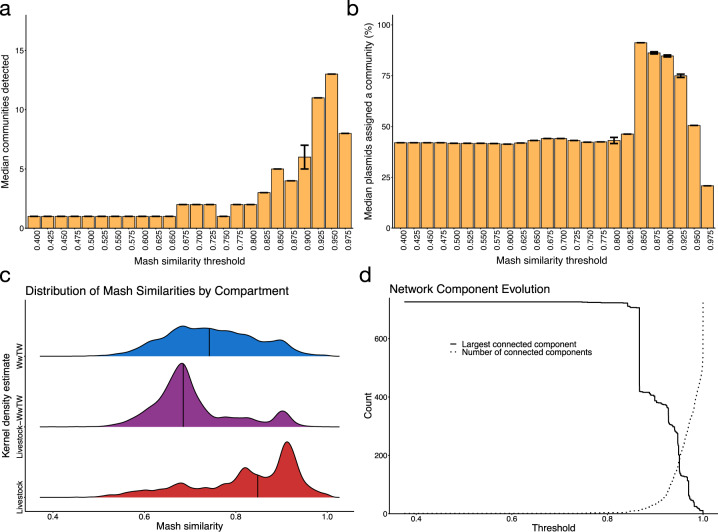
Fig. 2. Thresholding the plasmid network.
a Number of communities (at least 10 nodes) detected over a varying Mash similarity threshold. Median and IQR bar shown. b Cumulative proportion of nodes recruited in a detected community of at least ten nodes over a varying Mash similarity threshold. Median and IQR bars shown. c Gaussian kernel density estimates of Mash similarities stratified by compartment. Bandwidth = 0.00864 calculated by Silverman’s ‘rule of thumb’. Density medians are indicated with vertical lines. d Evolution of the largest connected component and number of components over a varying Mash similarity threshold.

