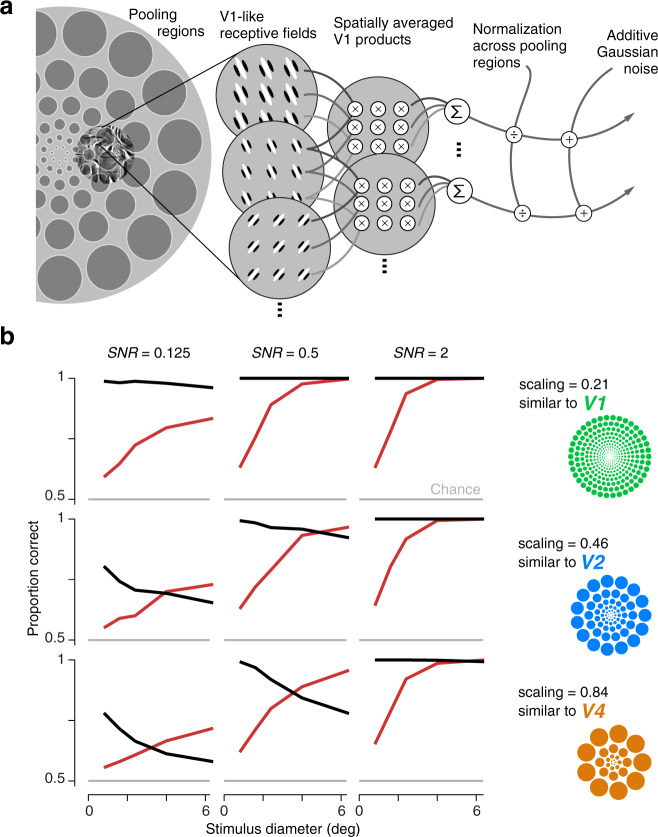
Fig. 3. A two-stage observer model predicts opposing perceptual effects.
a Starting from V1-like responses (rectified responses of oriented filters), the model computes 668 local pairwise statistics over pooling regions whose sizes grow in proportion to eccentricity (depicted in cartoon form as nonoverlapping discs—actual model responses are computed with smoothly overlapping weighting functions that cover the visual field). Each summary statistic is normalized by the magnitude of responses across all pooling regions, and corrupted by Gaussian noise. The observer response is obtained by computing the Euclidean distance between response vectors for both pairs of images as in the psychophysical AXB design, and selecting the pair with the larger distance. Performance for each condition of noise level, scaling, and stimulus diameter is computed by averaging simulations over 10,000 repeated experiments on 15 samples from four families (as in the perceptual experiments). b Performance on family (red) and sample (black) discrimination tasks, as a function of stimulus diameter, for observer models with three different levels of noise and three different scaling values. The average signal-to-noise ratio (SNR) was computed separately for each scaling by dividing the variance in responses across all stimuli and pooling regions by the variance of the Gaussian noise. Scaling values (stimulus diameter divided by eccentricity) are matched to estimates from visual areas V1, V2, and V4. Source data are provided as a Source Data file.

