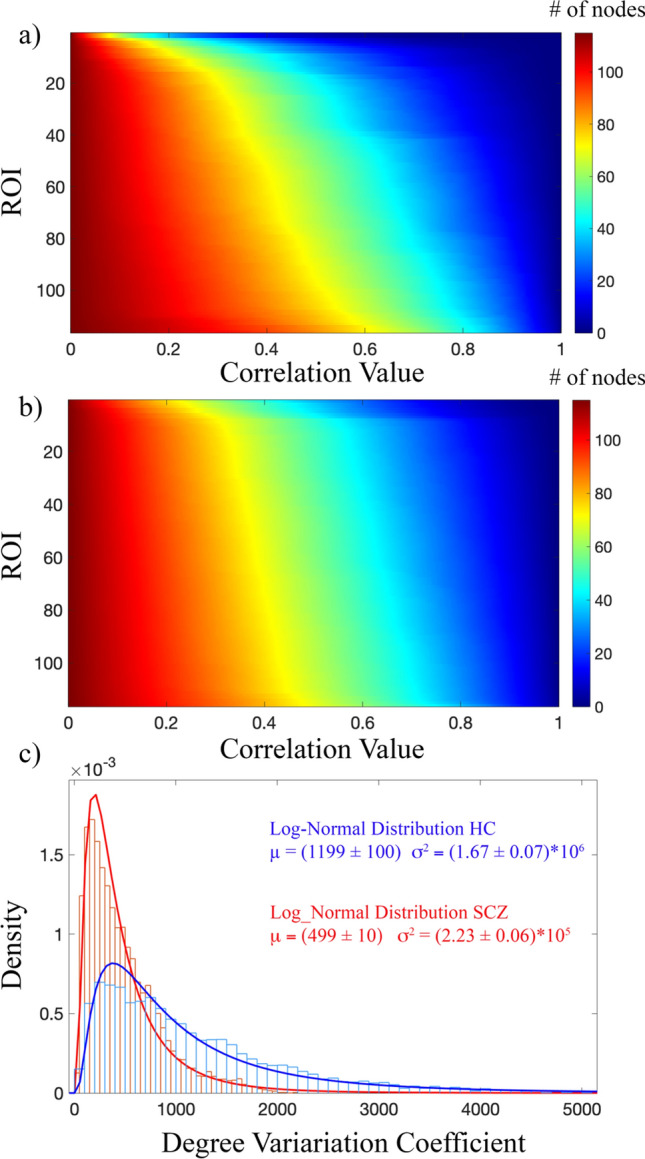
Figure 7.

Percolation and node degree analysis. (a) Variation of the node degree averaged across subjects for HC. (b) Variation of the node degree averaged across subjects for SCZ, (c) density of the distribution of the Degree Variation Coefficients for HC (blue) and SCZ (red). Data were fitted to a log-normal distribution with mean μ and variance σ2. The curve fitting results are reported for both HC and SCZ with the errors of the fitting procedure. According to a Mann–Whitney–Wilcoxon test, the two distributions resulted significantly different (Z = 51, p < 0.001).
