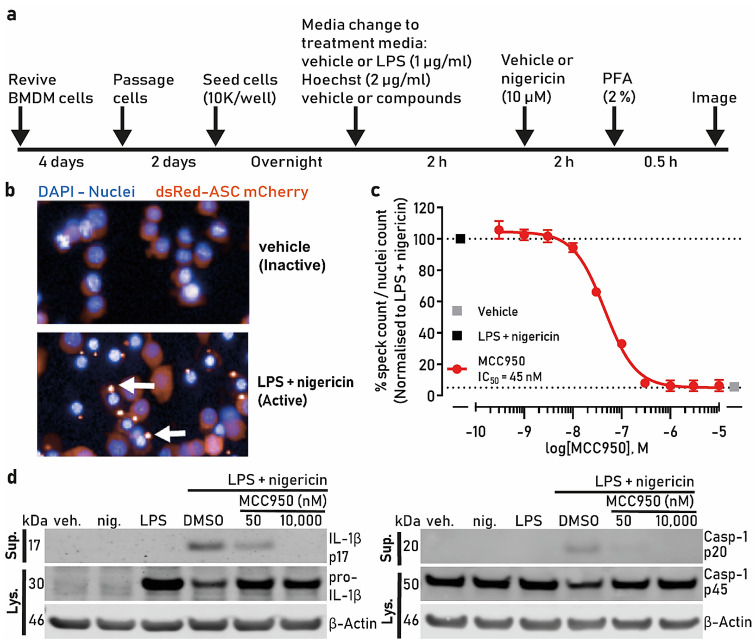
Figure 1.
High-content imaging assay development. (a) Schematic of the assay protocol. (b) Untreated iBMDM cells show weak mCherry fluorescence, which strongly increases and localizes into a speck after inflammasome activation with LPS and nigericin (white arrows). Cell nuclei are visible in blue and ASC-mCherry in red. (c) ASC-mCherry iBMDM cells were treated with the indicated concentrations of MCC950 and LPS (1 µg/ml) for 2 h followed by nigericin treatment (10 µM, 2 h) after which PFA was added. The percentage of ASC specks/total nuclei normalised to LPS and nigericin is presented; (d) Immunoblot of pro-IL-1β and cleaved IL-1β (IL-1β p17), pro-caspase-1 (p45) and caspase-1 (p20) in the cell lysates and supernatants after cell stimulation with LPS + nigericin in the presence or absence of MCC950 (50 or 10,000 nM). β-actin was used as a loading control for the cell lysate samples. The IL-1β and caspase-1 bands are cropped from their respective blot images and the full-length blots are presented in Figure S5. Data in (c) are presented as mean ± SEM, n = 3 independent experiments and was analyzed using GraphPad Prism version 7 software (https://www.graphpad.com/scientific-software/prism/).

