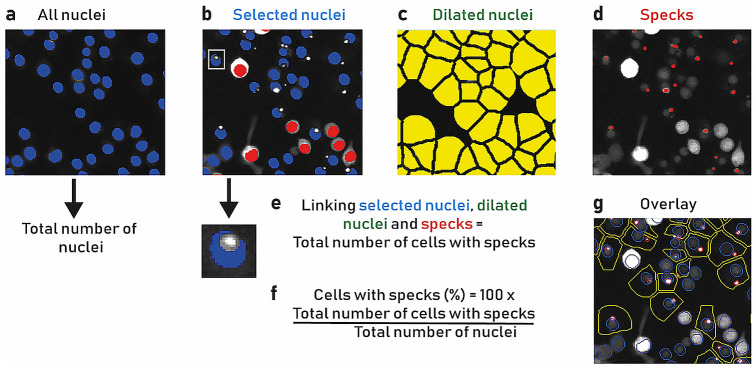
Figure 2.
Speck image analysis pipeline. (a) All nuclei (blue) were segmented, and the total number of nuclei were counted. (b) Very bright mCherry fluorescent cells were removed from the analysis to avoid incorrect speck segmentation. This was achieved by measuring the mCherry intensity in the nucleus minus spot masks (see inset) and rejecting cells above a fixed intensity level threshold (red) and selected nuclei (blue) were retained. (c) Nuclei were dilated (yellow) to give a pseudo cell region where specks were counted. (d) Specks were segmented. (e) The selected nuclei, dilated nuclei and specks were linked together to yield the total number of cells with specks. (f) The final calculation consisted of the ratio between the total number of cells with specks and the total number of nuclei and multiplying it to 100 to calculate the percentage of cells with specks. (g) Example segmentation overlay after analysis, nuclei (blue), cells (yellow) and specks (red).

