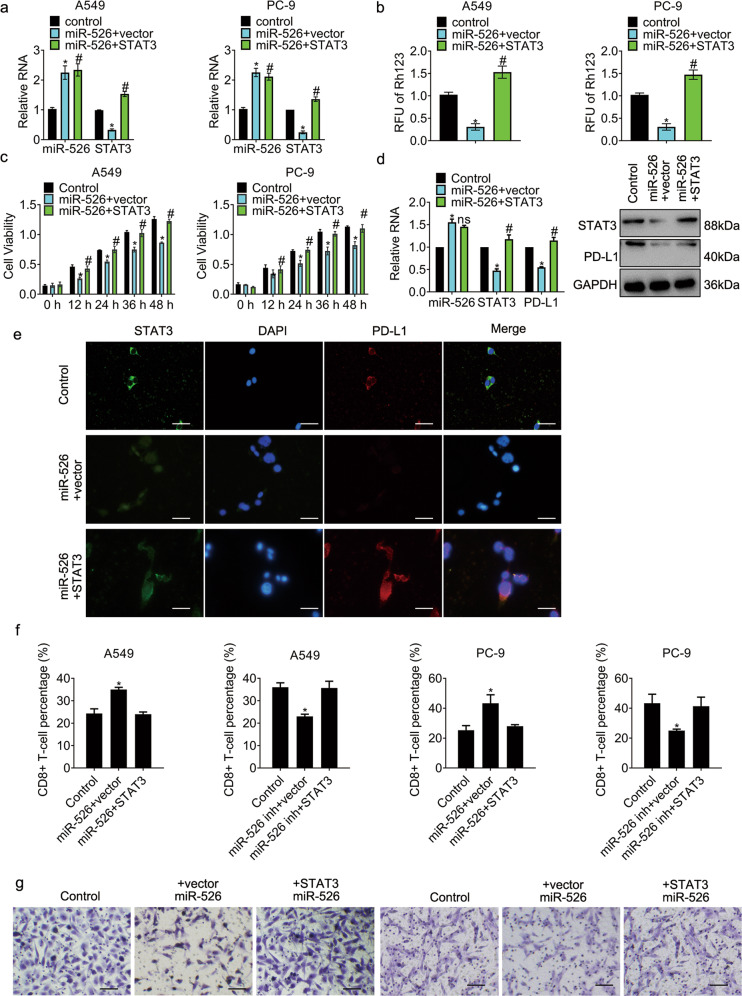
Fig. 4. STAT3 overexpression overwhelms the inhibition of miR-526b-3p in cancer cells.
a miR-526b-3p and STAT3 expression is accessed by qRT-PCR. b The activity of MDR1 is measured by rhodamine123 efflux assay. RLU relative fluorescence of unit. c The viability of the indicated cells is accessed by MTT assay. d The expression of the indicated genes is detected by qRT-PCR and Western blot, separately. e Representative immunofluorescent images of STAT3 and PD-L1 in A549 cells are shown. f The percentage of CD8 positive T-cells in the indicated cells are accessed by flow cytometry analysis. g The motility of the indicated cells was detected by transwell migration assay. Scale bar, 100 µm. *, P < 0.05 vs control. #, P < 0.05 vs miR-526b-3p plus vector.

