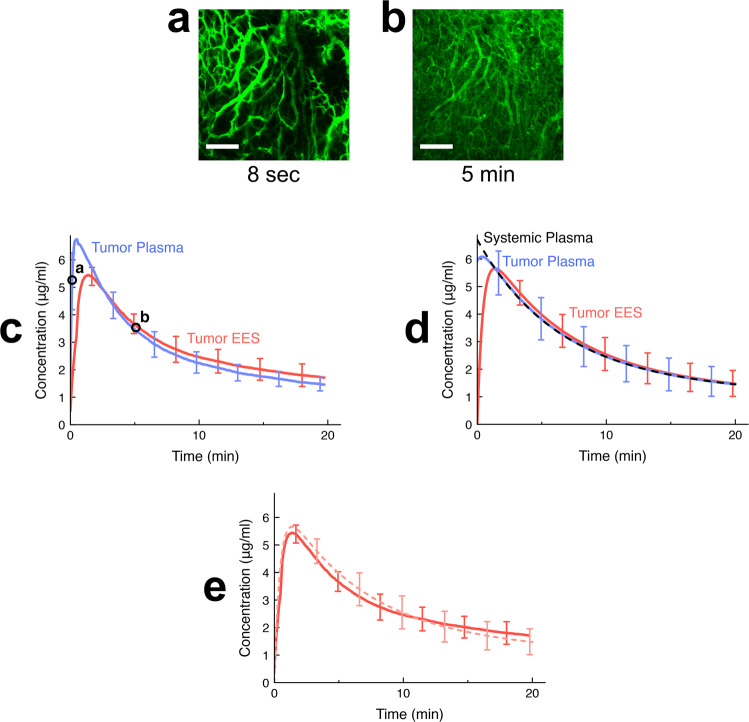
Fig. 2. Delivery kinetics of unencapsulated dye in vivo and in computer model.
A bolus of unencapsulated fluorescent dye (carboxyfluorescein (CF)) was administered to tumor-bearing mice. a Intravital microscopy visualizes arrival of dye in the tumor vasculature, here shown 8 s after injection. Scale bar indicates 200 μm. b Uptake of dye by tumor extravascular-extracellular space (EES) is apparent, shown 5 min after injection. The whole image time series is available as Suppl. Movie 1. c Mean dye concentrations in plasma and EES in imaged tumor segment were extracted from imaging data (image acquisition every 4 s). Time points of microscopy images shown in (a, b) are indicated by circles. Error bars indicate standard deviation (n = 3 animals). d Computer simulations based on tumor transport parameters derived from in vivo studies accurately reproduce the delivery kinetics of unencapsulated (free) dye. Error bars indicate model uncertainty due to uncertainty of model parameters. The mean normalized error of tumor EES concentration of the computer model was 3.8%. e Direct comparison of tumor EES concentration between computer model (solid curve) and intravital data (faint dotted curve).

