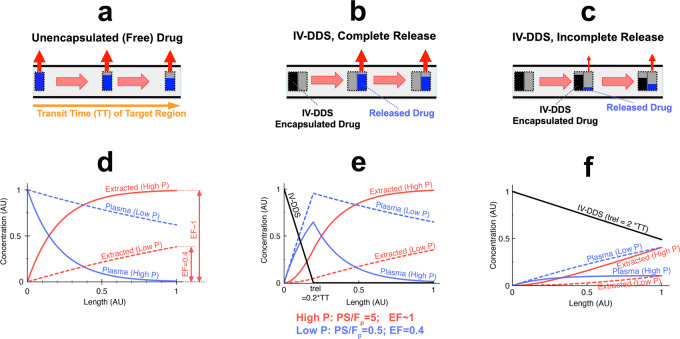
Fig. 3. Schematic of microvascular concentration gradient.
Plasma traverses the microvasculature between supplying artery and draining vein of the target tissue segment. Plasma concentration of unencapsulated/released drug (blue bar), and IV-DDS-encapsulated drug (black bar) are shown, with red arrows indicating tissue drug uptake (transvascular transport into interstitium/EES). Three cases are presented: a Unencapsulated drug infusion, b IV-DDS with complete release during transit (trel << TT), and c IV-DDS with incomplete release (trel >> TT). d–f For each case (a–c), the corresponding longitudinal concentration gradients along microvasculature length are shown based on computer models: free drug plasma concentration (blue), cumulative extracted amount by tissue (red), and IV-DDS-encapsulated drug plasma concentration (black). Both a drug with high permeability that is rapidly extracted (“High P”, solid lines; PS/Fp = 5; EF~1), and a drug with lower permeability and slow extraction (“Low P”, dashed lines; PS/Fp = 0.5; EF = 0.4) are presented. Note that all figures show the first pass where no drug has yet been extracted (i.e. interstitial/EES concentration is zero).

