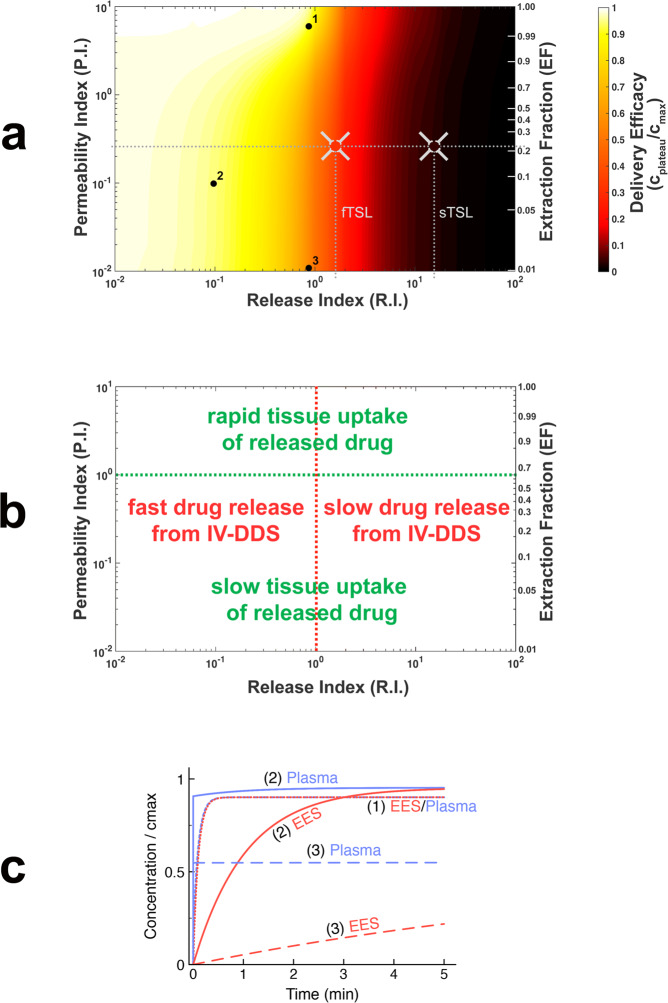
Fig. 5. Two key parameter indices dictate IV-DDS delivery.
a Computer model was used to conduct a parametric study of the interaction of the two indices that affect the plateau concentration (cplateau). These two indices depend on IV-DDS release time (trel), tissue transit time (TT), the vascular permeability-surface area product (PS), and plasma perfusion (Fp): release index R.I. = trel/TT (x-axis) and permeability index P.I. = PS/Fp (y-axis). First-pass extraction fraction (EF) directly depends on P.I. and is indicated on the second y-axis on the right. Delivery efficacy is represented by the plateau concentration relative to maximum (cplateau/cmax), and is indicated by a color scale. The dotted horizontal line indicates the permeability index P.I. based on in vivo tumor parameter measurements with unencapsulated dye (Table 2); vertical dotted lines indicate the release index R.I. for fTSL and sTSL, based on experimental measurements (Table 2). The intersections of the horizontal and vertical dotted lines indicate the location of experimental in vivo results for fTSL and sTSL in this map, with the color inside the gray crosshairs corresponding to measured in vivo plateau concentration (see Fig. 4c). b Parametric map from (a) with annotations indicating how release index (R.I.) and permeability index (P.I.) correspond to rate of IV-DDS drug release and rate of tissue drug uptake, respectively. c Concentration time courses for three specific cases, indicated by black dots (marked 1–3) in (a) ((a) is based on 1200 such simulations). EES and plasma concentration curves are marked (1)–(3) accordingly. The plateau concentration is equal to the concentration at t = 5 min for cases (1) and (2); (3) only reaches the plateau at t >> 5 min. Parameters from Table 1 were considered, with exception of trel and PS; the latter were adjusted to obtain desired indices R.I. and P.I. For highly permeable drugs (case (1); EF~1), a release time in the range of the tissue transit time (i.e. R.I. = trel/TT < = 1) is sufficient for near optimal delivery. For lower permeable drugs (case (2), EF = 0.1), about 10× faster release is ideal (i.e. R.I. = trel/TT < = 0.1). For drugs with very low permeability (case (3); EF = 0.01), the duration to achieve relevant tissue drug uptake is likely prohibitive, making such drugs poor choices. Many common clinical chemotherapy agents have EF in the range of 0.2 to 1 (see Table S5).

