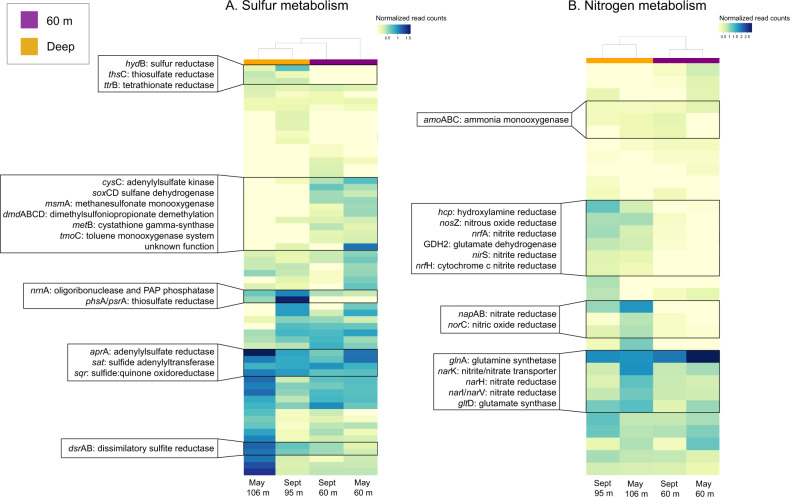
Fig. 7. Heat map of gene relative abundances in each of the four metagenomes.
Color bars show the depth group of the metagenome (60 m or “Deep,” 95 or 106 m). A Genes involved in sulfur metabolism. B Genes involved in nitrogen metabolism. Some dissimilatory genes, such as dsrAB and napAB, are enriched in the deep water layer. Others, including nitrate, nitrite, and nitrous oxide reductases, are enriched in the 60 m layer. Samples clustered by depth grouping in both categories.

