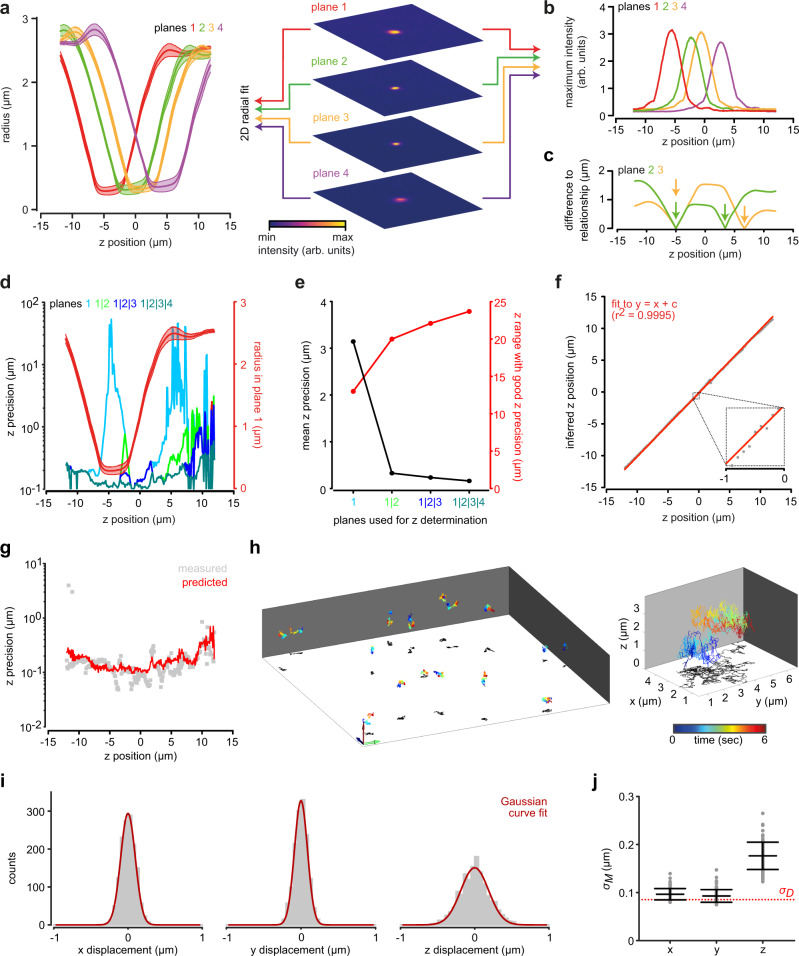
Fig. 2. Localizing latex beads in z using four focal planes.
a–c Characterizing the relationship between the image and the z-position of a latex bead (diameter 500 nm) in the MFI setup, equipped with a ×20 objective (NA 0.5) and a ×1.6 magnification changer. a Bead radius determined by a circle fit as a function of z-position; mean ± standard deviation of n = 7 beads (left). MF images of a latex bead at an exemplary z-position (right). b Maximum intensity of the bead image as a function of the bead’s z-position in the four focal planes for one exemplary bead. c Difference between the measured bead radius and the calibrated relationship between bead radius and z-position (from panel a) reveals two possible bead z-positions as minima (arrows) for each imaging plane. The overlay of the difference functions from two planes determines the bead’s z-position unequivocally. d Predicted z-precision at different z-positions and e mean z-precision of all z-positions using plane 1 only, planes 1 and 2, planes 1 to 3, or planes 1 to 4. For comparison, the relationship between bead radius and z-position for plane 1 is overlaid in d (red). The range of z-positions with a z-precision better than 0.5 µm is overlaid in e (red). The z-precision was predicted based on the calibrated relationship shown in a (see Methods). f z-position of a nonmoving bead inferred from MF images based on the calibrated relationship between bead radius and z-position during modulation of the objective z-position with a piezo (step size: 0.1 µm). A linear curve with a unity slope was fit to the data. g z-precision measured as the standard deviation of the residuals of linear curve fits with unity slope to the inferred z-positions during modulation of the objective z-position (gray), determined from n = 5 beads. The z-precision predicted as in d was overlayed (red). h Representative 3D trajectories of freely diffusing latex beads, displaying a characteristic Brownian motion. Magnified view of an individual trajectory on the right. The z-positions of the beads were inferred by multifocal image analysis. Arrows indicate 10 µm. i Characterization of bead displacement between consecutive frames (n = 81 beads), demonstrating that the displacement of the bead is normally distributed in x, y, and z. j From the variance of the measured bead displacement and that predicted by diffusion of the 500 nm beads (standard deviation shown as red dotted line) a localization precision of 45, 37, and 154 in x, y, and z, respectively, can be estimated (see Methods). Data points represent individual beads tracked for a mean duration of 3.3 s. n = 81 beads. Bars indicate mean ± standard deviation. Source Data are available as a source data file.

