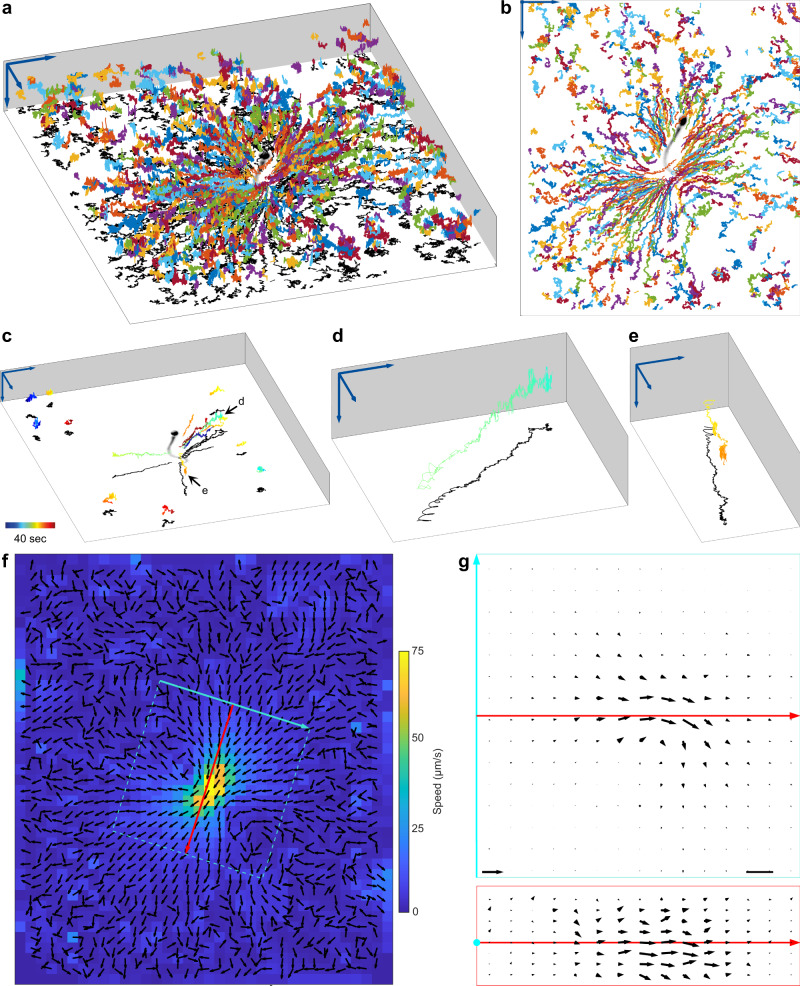
Fig. 6. 3D particle imaging velocimetry around a sperm cell.
a, b Exemplary 3D trajectories of latex beads flowing around a human sperm cell tethered to the cover glass at the head. Each trajectory is depicted in a different color. Arrows indicate 20 µm. Perspective (a) and top (b) views are shown. The bead trajectories have been projected onto an image of the tracked sperm cell (intensity inverted for better visualization, beads removed by image processing). Arrows indicate 20 µm. c Trajectories (color-coded by time) of few exemplary beads from b. Beads that are remote from the flagellum show Brownian motion; close to the sperm flagellum the beads display a 3D spiraling motion. Time color-coded as indicated. Black arrows mark trajectories magnified in d and e. The other trajectories shown are magnified in Supplementary Fig. 11. d Trajectory of a bead that is attracted to the sperm cell. e Trajectory of a bead that moves away from the flagellum. f Averaging z-projection of the 3D flow profile obtained from the bead motion, for which exemplary trajectories are shown in a–e. The cyan and red arrows indicate a new coordinate system, which is used as a reference to show the 3D flow profile in g. Black arrows are normalized. Flow speed is color-coded. g Flow profile sections in the vicinity of the sperm flagellum, extracted from the 3D flow at the positions marked with cyan and red lines/rectangles in (f). Cross-section (bottom) and top view (top) are shown. Scale bar: 5 µm. Arrow on bottom left indicates 125 µm s−1. Source Data are available as a source data file.

