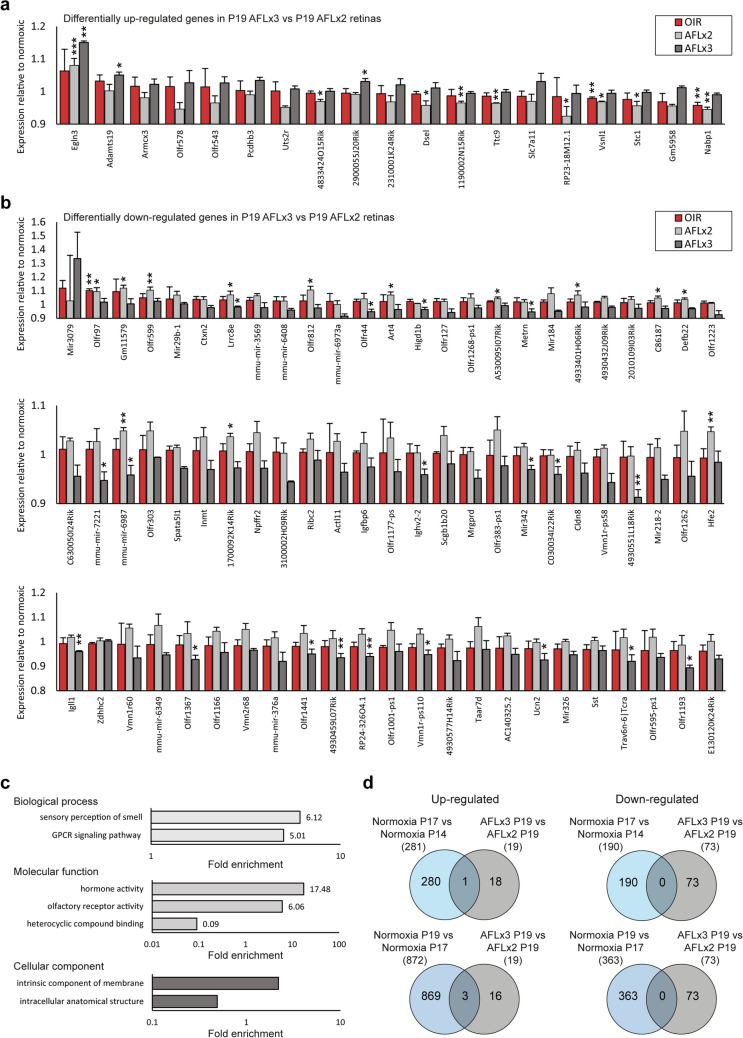
Figure 6.
Differentially expressed genes in P19 OIR + AFL(× 3) relative to P19 OIR + AFL(× 2) retinas, GO terms enriched among them, and comparison with differentially regulated genes throughout murine retinal development. (a,b) Expression levels of genes differentially up-regulated (a) and down-regulated (b) in P19 OIR + AFL(× 3) relative to P19 OIR + AFL(× 2) retinas. Expression is shown for P19 OIR, OIR + AFL(× 2) and OIR + AFL(× 3) retinas normalized to the expression level detected in normoxic age-matched tissues. (c) GO terms enriched in the list of differentially expressed genes in P19 OIR + AFL(× 3) retinas relative to P19 OIR + AFL(× 2) retinas. Domains: biological process, top; molecular function, middle; cellular component, bottom. (d) Venn diagrams of differentially up-regulated (left) and down-regulated (right) genes in P19 OIR + AFL(× 3) retinas relative to P19 OIR + AFL(× 2) ones and during normal retinal development in the P14 to P17 period (top) or in the P17 to P19 timeframe (bottom). In (a,b) error bars depict + 1 S.E.M. and statistical significance was calculated relative to expression levels in age-matched normoxic retinas. *P < 0.05; **P < 0.01; ***P < 0.001.

