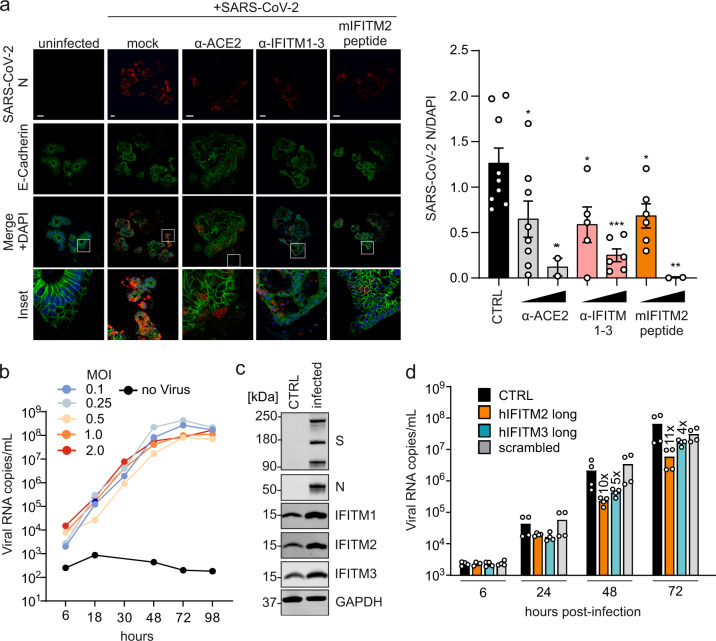
Fig. 6. Blocking antibodies and IFITM-derived peptides treatment decrease SARS-CoV-2 infection in gut organoids and cardiomyocytes.
a Immunohistochemistry of gut organoids treated with blocking antibodies and a mouse IFITM2 (mIFITM2) derived peptide and infected with SARS-CoV-2 (MOI 0.15). Organoids were stained with α-SARS-CoV-2 N (red), E-Cadherin (green), and DAPI (blue). Scale bar, 100 µm (left panel). Quantification of SARS-CoV-2 N fluorescence, normalized to DAPI (right panel). Bars represent the mean of CTRL:9, α-ACE2 15 µg/ml:8, α-ACE2 30 µg/ml:2, α-IFITM1-3 15 µg/ml:5, α-IFITM1-3 30 µg/ml:6, mIFITM2 peptide 15 µg/ml:6, or mIFITM2 peptide 30 µg/ml:2 individual images over one experiment (±SEM), unpaired t-test with Welch’s correction All p values were calculated compared to CTRL (α-ACE2 15 µg/ml: 0.0104, α-ACE2 30 µg/ml: 0.0093, α-IFITM1-3 30 µg/ml: 0.0002, mIFITM2 peptide 15 µg/ml: 0.0295, mIFITM2 peptide 30 µg/ml: 0.005). b Quantification of viral N RNA levels in the supernatant of SARS-CoV-2 infected cardiomyocytes (increasing MOIs as indicated) at indicated time points. Lines represent a single experiment measured in duplicates. c Immunoblot of IFITM1, IFITM2, and IFITM3 in cardiomyocytes infected with SARS-CoV-2. Whole-cell lysates were stained with α-IFITM1, α-IFITM2, α-IFITM3, and α-GAPDH. n = 1. d Quantification of viral N RNA levels in the supernatant of SARS-CoV-2 infected cardiomyocytes (MOI 0.1) treated with IFITM-derived peptides, collected at indicated time points post-infection. Bars represent the mean of two independent experiments each measured in technical duplicates. Non-infected controls were below the quantification level (<1000). Exact p values are provided in Supplementary Data 1. p Values are indicated as *p < 0.05; **p < 0.01; ***p < 0.001; ****p < 0.0001 or were not significant (p > 0.05).

