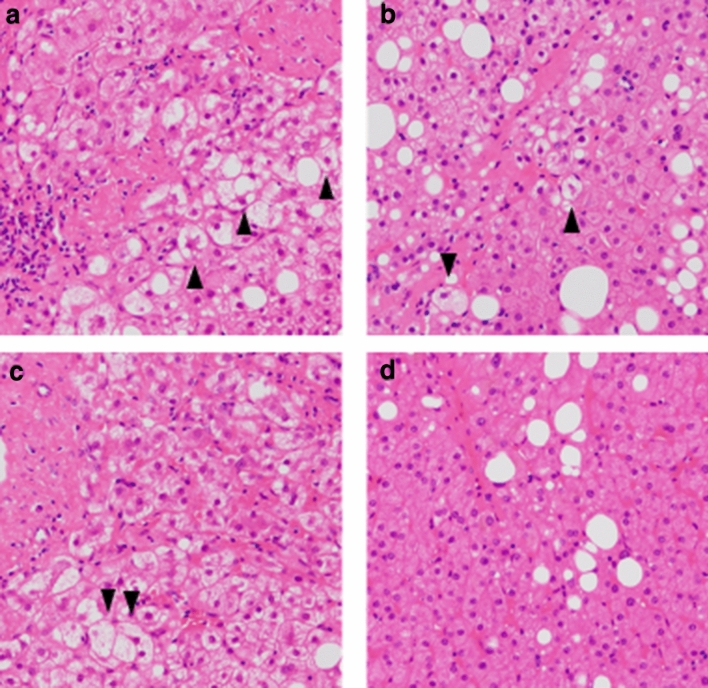
Figure 2.
Histological images indicating hepatocyte ballooning. Histological images of liver biopsies using hematoxylin–eosin staining in one high-power field. Histological images of hepatocyte ballooning at the baseline in both the elimination (a) and persistent groups (b), and at indicated times in the persistent group (c) are presented; the arrowhead indicates hepatocyte ballooning. Liver histology at the indicated time in the elimination group is presented for comparison (d).

