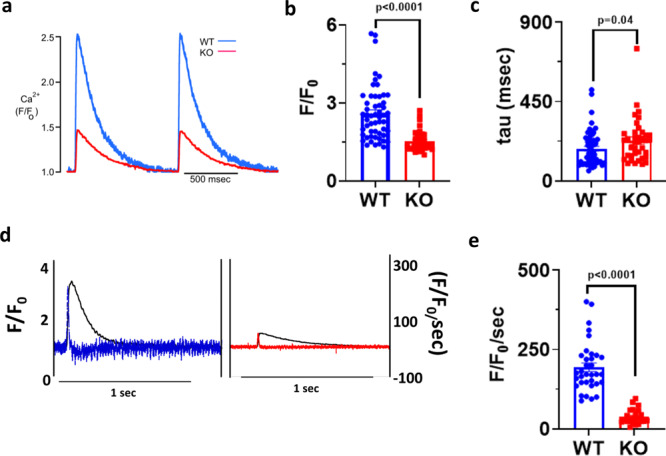
Fig. 3. Impaired calcium cycling in VDAC2-KO cardiomyocytes.

a Representative calcium transient image of 16-week-old mice (Time frame, 500 ms); b Amplitude (F/F0) data (p < 0.0001) (WT n = 54, KO n = 38, N = 3); c Rate of calcium uptake (tau) (ms) (p = 0.0492) (WT n = 54, KO n = 38, N = 3); d Representative image of rate of calcium release of 16-week-old mice (Time frame, 1 s); e Rate of calcium release (F/F0/s) (p < 0.0001) (WT n = 34, KO n = 23, N = 3). p-value: unpaired two-tailed t-test performed in all comparisons. Data are represented as mean ± SEM.
