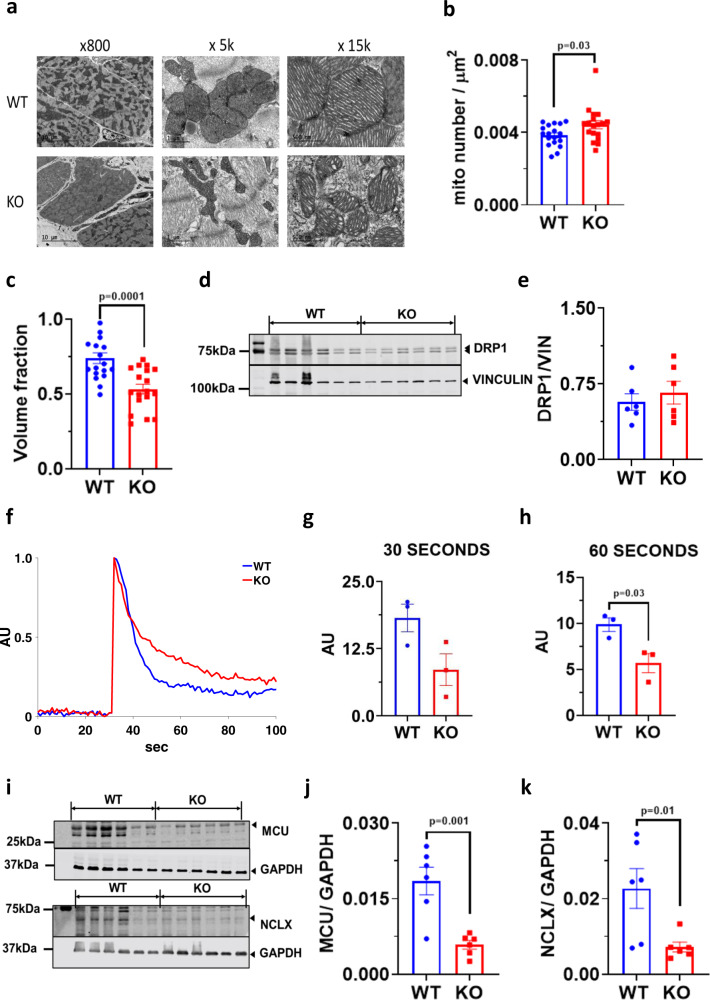
Fig. 6. Altered mitochondrial structure and function in VDAC2-KO.
a Representative transmission electron microscopy image at ×800, ×5000 and ×15,000 magnifications (scale bar, 10 μm, 1 μm, and 500 nm, respectively) (n = 3); b Number of mitochondria per unit area measured using Adobe Photoshop CC 2019 (p = 0.0365) (n = 18 images, N = 3); c Mitochondrial volume fraction measured using Adobe Photoshop CC 2019 using 22 × 14 grid (p = 0.0001) (n = 18 images, N = 3); d, e Western blot image of DRP1 and lane-loading control VINCULIN and quantification using Image Studio Lite (version 5.2.5) (p = ns) (n = 6); f Representative mitochondrial calcium uptake image produced using MATLAB (n = 3); g, h Mitochondrial calcium uptake in the first 30 s (p = ns) and 60 s of calcium pulse (p = 0.0300) (n = 3), respectively; i–k Western blot image of MCU (p = 0.0014) and NCLX (p = 0.0169) along with respective lane-loading control GAPDH and quantification using Image Studio Lite (version 5.2.5) (n = 6). p-value: unpaired two-tailed t-test performed in all comparisons. Data are represented as ±SEM.

