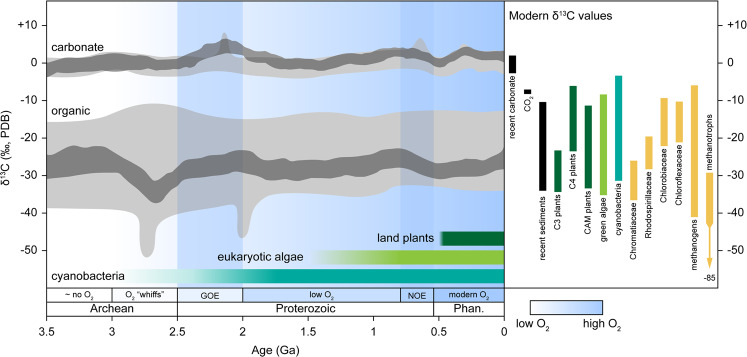
Fig. 1. The geologic record of δ13C values has remained essentially constant over ~3.5 billion years.
Geologic carbonate and organic δ13C record (left) and modern δ13C values of inorganic carbon and biomass from diverse taxa (right). Light gray fields represent the range of geologic δ13C measurements from Schidlowski [6]. Dark gray fields represent 95% confidence intervals for smoothing analyses of geologic δ13C data from Krissansen-Totton et al. [7] and references therein. Modern δ13C values from Schidlowski [6]. Bars are colored as follows: black, geologic reservoirs; dark green, land plants; light green, green algae; teal, cyanobacteria; other taxa, yellow. Phases of atmospheric oxygen are labeled at the bottom, from Lyons et al. [24] (“~ no O2” indicates <10−5 present atmospheric level (PAL), “low O2” indicates ~10−1 to 10−4 PAL, and “modern O2” indicates PAL). Qualitative O2 levels are indicated by shades of blue, with lighter shades indicating lower O2 levels and darker shades indicating higher O2 levels (also noted by the scale). The Great Oxidation Event (GOE) and Neoproterozoic Oxidation Event (NOE) are indicated by darker blue bars. The earliest potential appearance of cyanobacteria is interpreted from the oldest known oxidized sediments [24, 59, 60]; of eukaryotic algae, from oldest interpreted algal fossils [139] and molecular clock dating [140, 141]; of land plants, from the oldest interpreted pollen fossils [142] and molecular clock dating [143]. PDB Pee Dee Belemnite δ13C standard, Phan. Phanerozoic (color figure online).

