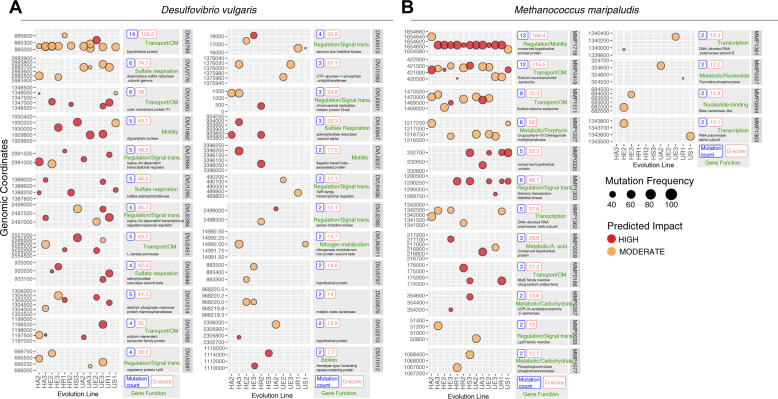
Fig. 2. Frequency and location of high G-score mutations in Dv (A) and Mm (B) across 13 independent evolution lines.
SnpEff predicted impact of mutations* are indicated as moderate (orange circles) or high (red circles) with the frequency of mutations indicated by node size. Expected number of mutations for each gene was calculated based on the gene length and the total number of mutations in a given evolution line. Genes with parallel changes were ranked by calculating a G (goodness of fit) score between observed and expected values and indicated inside each panel. Mutations for each gene are plotted along their genomic coordinates (vertical axes) across 13 evolution lines (horizontal axes). Total number of mutations for a given gene is shown as horizontal bar plots. [*HIGH impact mutations: gain or loss of start and stop codons and frameshift mutations; MODERATE impact mutations: codon deletion, nonsynonymous in coding sequence, change or insertion of codon; low impact mutations: synonymous coding and nonsynonymous start codon].

