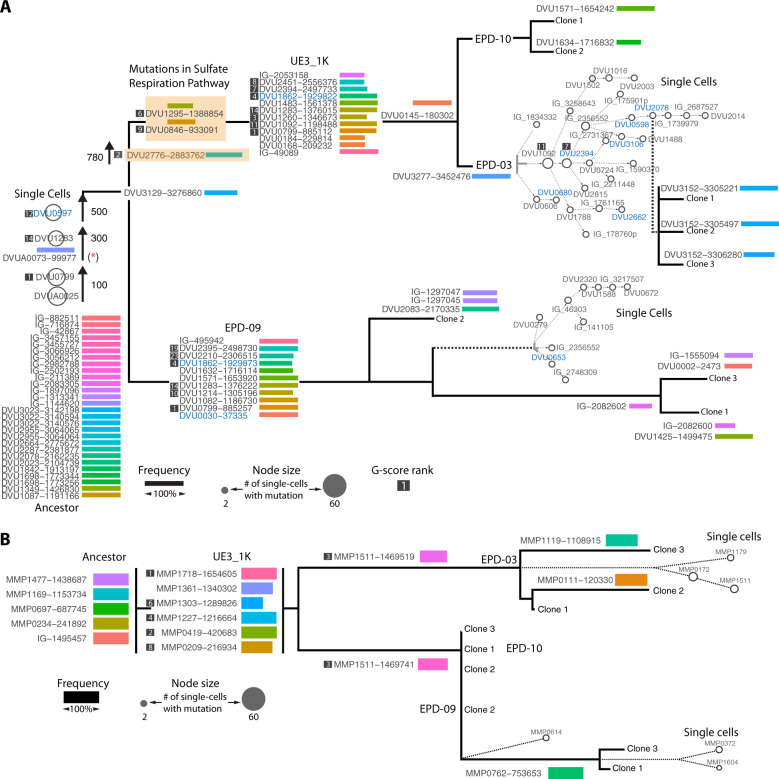
Fig. 5. Lineage map of mutational events deciphered through sequencing of up to 96 single cells of (A) Dv and (B) Mm from EPD-03 and EPD-09, cross-referenced with longitudinal bulk sequencing of UE3, EPDs and sequencing of clonal isolates.
Temporal ordering of mutations in the trunk is based on their order of appearance in longitudinal sequencing data across generations. Unique mutations within each lineage are shown together with frequency (length of bars). The single-cell lineage tree for each EPD was constructed using the algorithm SCITE and shown in the context of the parent EPD and linked to clonal isolates. (See Supplementary Figs. 2 and 3 for details). Mutation names for regulatory or signal transduction genes are colored in blue and SR-related genes are indicated with an orange shaded box. An asterisk indicates mutation in a plasmid gene that was not detected in single cells potentially due to loss of plasmid. Of the total 11 high G-score Dv genes in the 1 K generation of UE3, just three were observed in both EPDs. Note, the three high G-score genes DVU1862, DVU2394, and DVU0799 had mutations in different locations in the two EPDs. High G-score genes that were only observed in EPD-03 were DVU2451, DVU1260, and DVU1092, and those unique to EPD-09 were DVU2395, DVU2210, and DVU1214. In addition, SR− mutations in DVU0846 and DVU1295 were unique to EPD-03, appearing after 780 generations, and were present across single cells and all clonal isolates.

