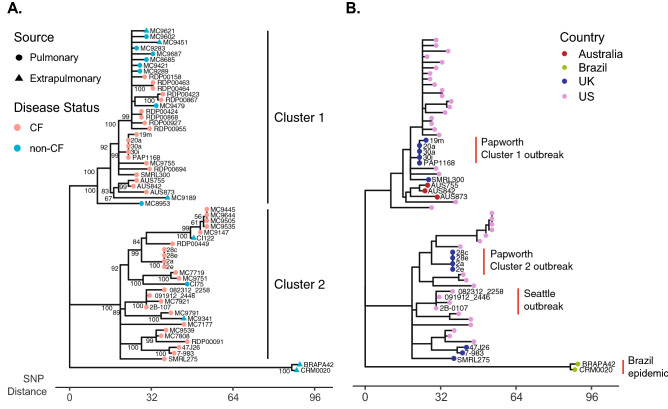
Figure 2.
Phylogenetic relationships of Clone 1 isolates. (A) Phylogenetic reconstruction of Clone 1 isolates (n = 58) and two Brazilian epidemic isolates (n = 2) was generated using core genome SNP data and the neighbor-joining method. Bootstrap support values (> 50%) after 100 replicate searches are shown. Isolates are labeled by sample source and patient disease status. (B) The same phylogeny is labeled by isolate country of origin and previously studied outbreaks are labeled with red bars.

