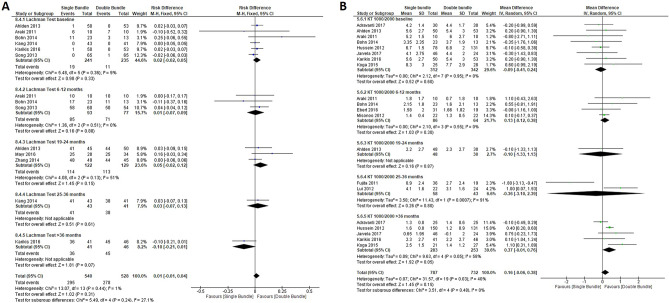
Figure 6.
Forest plots of knee anterior stability data for single-bundle versus double-bundle reconstruction. Weights are from fixed effects for the Lachman test analysis and random effects for the KT 1000/2000 analysis. (A) Dichotomous data for the Lachman test (6 studies in the baseline period, 476 patients; 3 studies in the 6–12-month period, 170 patients; 3 studies in the 19–24-month period, 251 patients; 1 study in the 25–36-month period, 84 patients and 1 study in the > 36-month period, 87 patients). The heterogeneity was low: χ2 = 13.07, df = 13 (P = 0.44); I2 = 1% (CI, confidence interval; M-H, Mantel–Haenszel). (B) Continuous data for KT-1000/2000 (8 studies in the baseline period, 654 patients; 4 studies in the 6–12-month period, 150 patients; 1 study in the 19–24-month period, 78 patients; 2 studies in the 25–36-month period, 101 patients and 5 studies in the > 36-month period, 536 patients). Heterogeneity was moderate: τ2 = 0.07; χ2 = 31.57, df = 19 (P = 0.03); I2 = 40% (CI, confidence interval; IV, inverse variance). Data collected from RevMan 5.3 software.

