
Fig. 3. Co-occurrence network of core gut microbial genera.
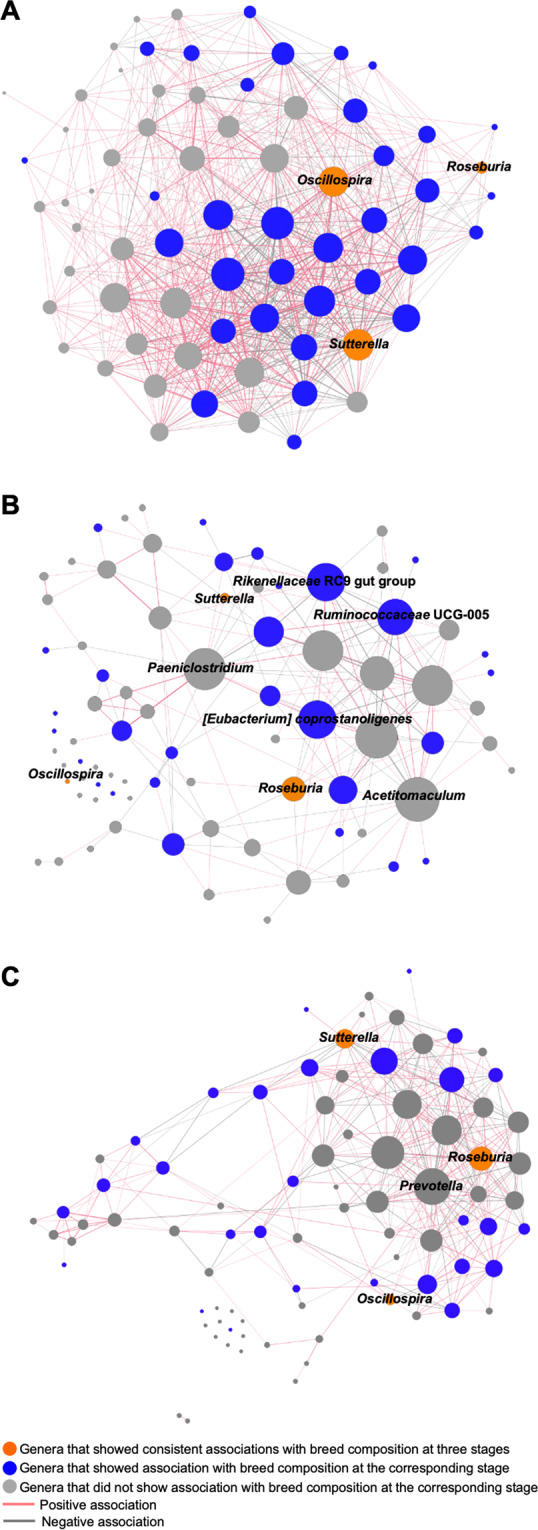
A–C Co-occurrence networks predicting the bacteria–bacteria interactions among core bacterial genera (present in at least 50% of the samples) in the preweaning (A), postweaning (B), and fattening (C) stages, respectively. Connections were detected based on Spearman’s rank correlations (rs > 0.25 or rs < −0.25, FDR-adjusted p < 0.001). Dot sizes represent number of connections with other taxa. Thickness of edges represent strength of relatedness. Dot color represents the relationship between relative abundance of bacterial genera and breed composition. Edge color represents either positive or negative associations between bacteria.