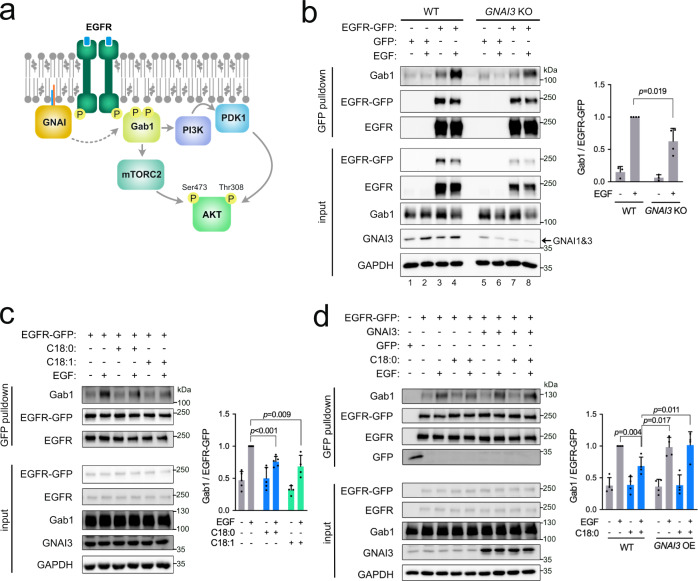
Fig. 5. C18:0 and C18:1 reduce recruitment of Gab1 to EGFR via GNAI proteins.
a Schematic diagram of the role of GNAI in EGFR signaling. b The interaction of EGFR-GFP with Gab1 induced by EGF treatment (50 ng/mL for 5 min) is reduced in GNAI3 KO MCF7 cells. Quantified is the amount of Gab1 in the pulldown normalized to the amount of EGFR-GFP in the pulldown. Data are presented as mean ± SEM of four biological replicates, p-values determined by two-sided t-test with correction for multiple comparisons using the Holm–Sidak method. c Exposure of MCF7 cells to C18:0 or C18:1 (both 100 µM, 3 h) blunts the interaction of EGFR-GFP with Gab1 induced by EGF (50 ng/mL, 5 min). Quantified is the amount of Gab1 in the pulldown normalized to the amount of EGFR-GFP in the pulldown. Data are presented as mean ± SEM of four biological replicates, p-values determined by two-sided t-test with correction for multiple comparisons using the Holm–Sidak method. d Overexpression of GNAI3 rescues the effect of C18:0 (100 µM, 3 h) on Gab1 recruitment to EGFR-GFP upon EGF stimulation (50 ng/mL for 5 min). Quantified is the amount of Gab1 in the pulldown normalized to the amount of EGFR-GFP in the pulldown. Data are presented as mean ± SEM of four biological replicates and the p-values were calculated by two-sided t-test with correction for multiple comparisons using the Holm–Sidak method.

