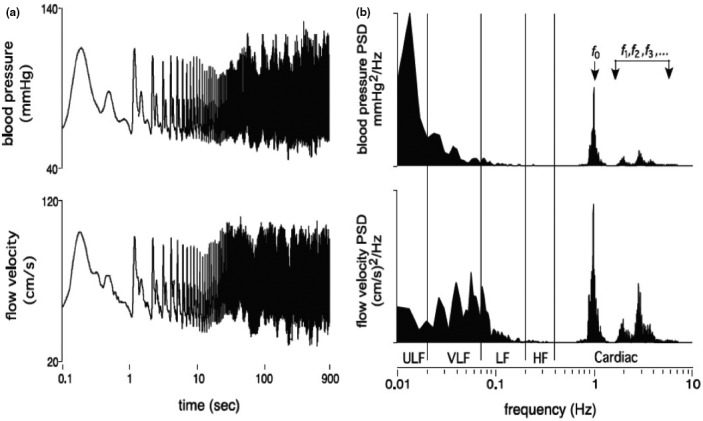
FIGURE 3.

(a) Finger arterial blood pressure and middle cerebral blood flow velocity over 900 s (presented on log axes) for a human subject in the seated resting position. (b) The corresponding power spectrums, which decompose the time series signals into its various constituent component frequencies. Note that the fundamental frequency (f 0) and its harmonics (f 1, f 2,f 3) correspond to pulsations coincident with the pulse, whereas progressively lower frequency components reflect the longer term oscillations and trends in the time domain. ULF ultra‐low frequency, VLF very low frequency, LF low frequency, HF high frequency. Reprinted from Tzeng & Ainslie (2013) with permission
